Introduction – Carbon Footprint Of Agricultural Products
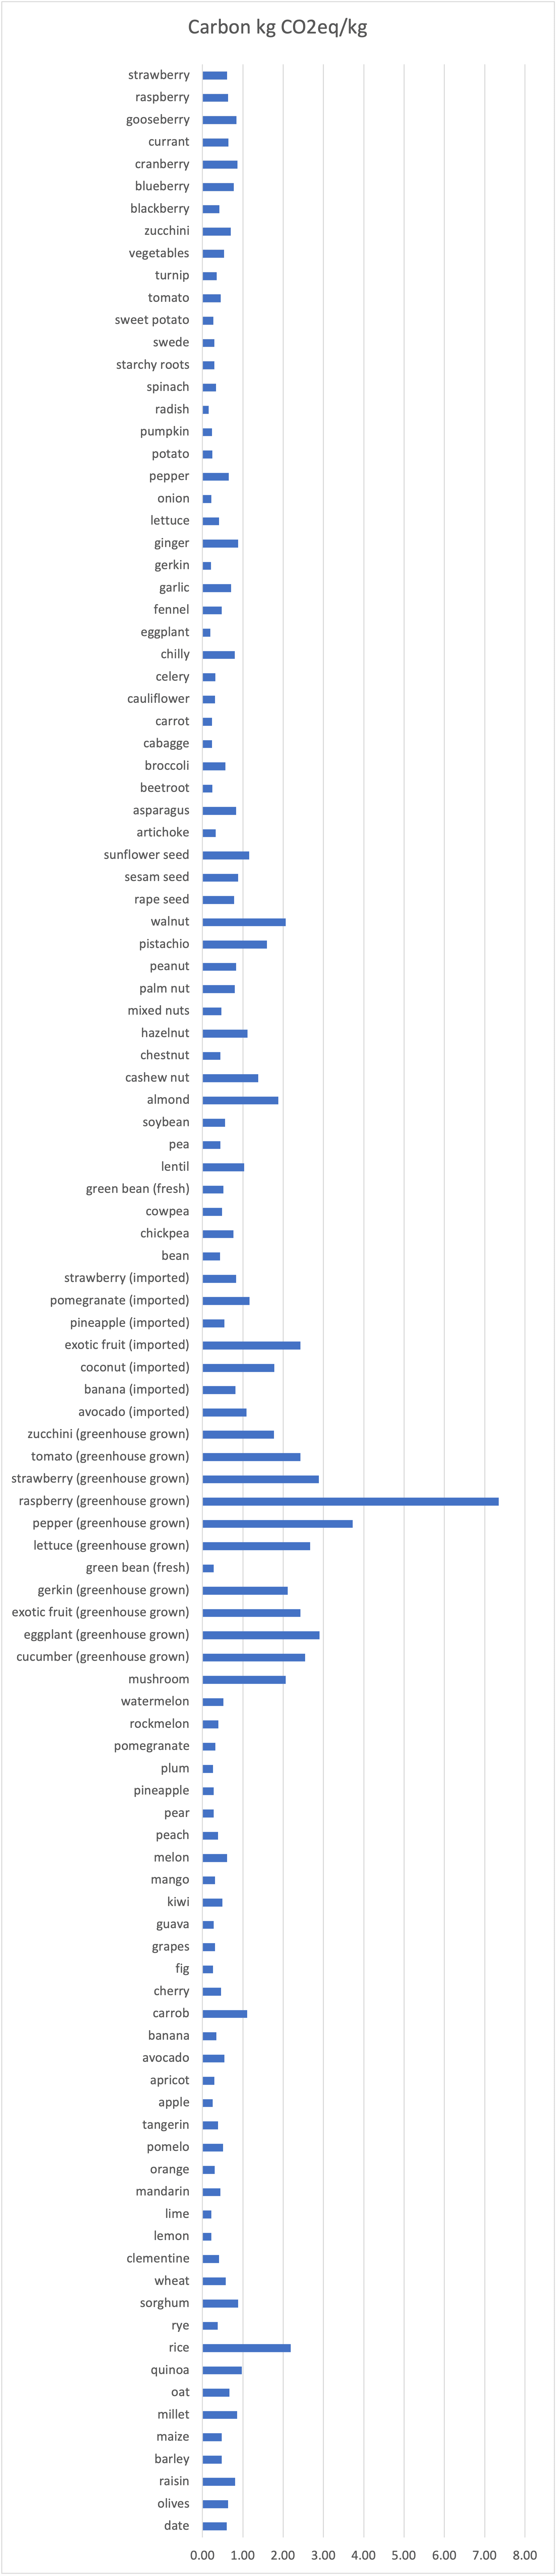
Carbon footprint of non-processed agricultural products, from non-animal, agricultural sources. Data was obtained from caloric values per kg and also a study by researchers Petersson and Castaldi 2021.
We will present the data in both table and chart form. Carbon intensity must be estimated by considering the process of production. There are not technologies that measure it directly.
Because each study estimates carbon intensity differently, there will be discrepancies between values given here and elsewhere on this site. Consider averaging over multiple sources to get the most accurate estimate.
Note that a type of product like strawberries can appear twice. In this case it’s because strawberries are divided into an open-field type and a greenhouse type, which have different carbon intensities.
The greenhouse type tend to have higher carbon intensity because its grown under climate conditions that require additional energy for care.
The greenhouse grown varieties have the highest carbon intensities.
Go here for all other food categories and the carbon footprints.
Carbon Footprint Of Agricultural Products – Table
| Food item | Carbon kg CO2eq/kg | Type / Greenhouse |
| date | 0.60 | – |
| olives | 0.64 | – |
| raisin | 0.81 | – |
| barley | 0.48 | Cereals |
| maize | 0.48 | Cereals |
| millet | 0.86 | Cereals |
| oat | 0.67 | Cereals |
| quinoa | 0.97 | Cereals |
| rice | 2.19 | Cereals |
| rye | 0.38 | Cereals |
| sorghum | 0.88 | Cereals |
| wheat | 0.57 | Cereals |
| clementine | 0.41 | Citrus |
| lemon | 0.22 | Citrus |
| lime | 0.22 | Citrus |
| mandarin | 0.45 | Citrus |
| orange | 0.30 | Citrus |
| pomelo | 0.51 | Citrus |
| tangerin | 0.38 | Citrus |
| apple | 0.25 | Fruit |
| apricot | 0.30 | Fruit |
| avocado | 0.54 | Fruit |
| banana | 0.34 | Fruit |
| carrob | 1.10 | Fruit |
| cherry | 0.46 | Fruit |
| fig | 0.26 | Fruit |
| grapes | 0.31 | Fruit |
| guava | 0.28 | Fruit |
| kiwi | 0.49 | Fruit |
| mango | 0.31 | Fruit |
| melon | 0.61 | Fruit |
| peach | 0.39 | Fruit |
| pear | 0.27 | Fruit |
| pineapple | 0.28 | Fruit |
| plum | 0.26 | Fruit |
| pomegranate | 0.32 | Fruit |
| rockmelon | 0.39 | Fruit |
| watermelon | 0.52 | Fruit |
| mushroom | 2.06 | Fungi |
| cucumber | 2.55 | Greenhouse grown |
| eggplant | 2.90 | Greenhouse grown |
| exotic fruit | 2.43 | Greenhouse grown |
| gerkin | 2.12 | Greenhouse grown |
| green bean (fresh) | 0.28 | Greenhouse grown |
| lettuce | 2.67 | Greenhouse grown |
| pepper | 3.73 | Greenhouse grown |
| pepper | 1.18 | Greenhouse grown |
| raspberry | 7.35 | Greenhouse grown |
| strawberry | 2.88 | Greenhouse grown |
| tomato | 2.43 | Greenhouse grown |
| tomato | 0.91 | Greenhouse grown |
| zucchini | 1.77 | Greenhouse grown |
| avocado | 1.09 | Imported |
| banana | 0.82 | Imported |
| coconut | 1.78 | Imported |
| exotic fruit | 2.43 | Imported |
| pineapple | 0.55 | Imported |
| pomegranate | 1.17 | Imported |
| strawberry | 0.84 | Imported |
| bean | 0.43 | Legumes |
| chickpea | 0.77 | Legumes |
| cowpea | 0.49 | Legumes |
| green bean (fresh) | 0.52 | Legumes |
| lentil | 1.03 | Legumes |
| pea | 0.45 | Legumes |
| soybean | 0.56 | Legumes |
| almond | 1.88 | Nuts |
| cashew nut | 1.38 | Nuts |
| chestnut | 0.44 | Nuts |
| hazelnut | 1.11 | Nuts |
| mixed nuts | 0.47 | Nuts |
| palm nut | 0.80 | Nuts |
| peanut | 0.83 | Nuts |
| pistachio | 1.60 | Nuts |
| walnut | 2.06 | Nuts |
| rape seed | 0.78 | Seeds |
| sesam seed | 0.88 | Seeds |
| sunflower seed | 1.16 | Seeds |
| artichoke | 0.33 | Vegetables |
| asparagus | 0.83 | Vegetables |
| beetroot | 0.25 | Vegetables |
| broccoli | 0.57 | Vegetables |
| cabagge | 0.23 | Vegetables |
| carrot | 0.24 | Vegetables |
| cauliflower | 0.31 | Vegetables |
| celery | 0.32 | Vegetables |
| chilly | 0.80 | Vegetables |
| eggplant | 0.19 | Vegetables |
| fennel | 0.48 | Vegetables |
| garlic | 0.71 | Vegetables |
| gerkin | 0.21 | Vegetables |
| ginger | 0.88 | Vegetables |
| lettuce | 0.41 | Vegetables |
| onion | 0.22 | Vegetables |
| pepper | 0.65 | Vegetables |
| potato | 0.24 | Vegetables |
| pumpkin | 0.24 | Vegetables |
| radish | 0.15 | Vegetables |
| spinach | 0.34 | Vegetables |
| starchy roots | 0.29 | Vegetables |
| swede | 0.29 | Vegetables |
| sweet potato | 0.27 | Vegetables |
| tomato | 0.45 | Vegetables |
| turnip | 0.35 | Vegetables |
| vegetables | 0.54 | Vegetables |
| zucchini | 0.70 | Vegetables |
| blackberry | 0.42 | Wild berries |
| blueberry | 0.78 | Wild berries |
| cranberry | 0.87 | Wild berries |
| currant | 0.64 | Wild berries |
| gooseberry | 0.84 | Wild berries |
| raspberry | 0.63 | Wild berries |
| strawberry | 0.61 | Wild berries |
Carbon Footprint Of Processed Agricultural Products – Chart

Anne Lauer
Anna Lauer is a writer, gardener, and homesteader living in rural Wisconsin. She has written for Mother Earth News, Grit, and Hobby Farms magazines. Anna is writing a new book about growing your food for free and an ultimate guide to producing food at little to no cost. When she’s not writing or gardening, Anna enjoys spending time with her husband and two young daughters.