Introduction – Carbon Footprint Of Fish
Carbon footprint of fish products including frozen, processed and shellfish. Data was obtained from caloric values per kg and also a study by researchers Petersson and Castaldi 2021. We will present the data in both table and chart form. Carbon intensity must be estimated by considering the process of production. There are not technologies that measure it directly. Because each study estimates carbon intensity differently, there will be discrepancies between values given here and elsewhere on this site. Consider averaging over multiple sources to get the most accurate estimate.
Note that there seems to be no distinction between farmed and wild caught fish. It may be that the data isn’t available yet and we’ll need a study to be conducted to get this. We expect farmed fish to be more efficient energy wise (and therefore less carbon intensive) although there are concerns about the environmental impact where the fishing occurs.
The greenhouse grown varieties have the highest carbon intensities.
Go here for all other food categories and the carbon footprints.
Carbon Footprint Of Fish – Table
| Food Item | Carbon kg CO2eq/kg | Type |
| diamond fish | 6.02 | fish |
| eel | 3.88 | fish |
| fish mixed | 4.99 | fish |
| flatfish | 6.41 | fish |
| flathead | 2.56 | fish |
| fork beard | 8.01 | fish |
| haddock | 3.10 | fish |
| hake | 10.40 | fish |
| herring | 1.24 | fish |
| ling | 6.45 | fish |
| mackerel | 1.80 | fish |
| megrim | 14.15 | fish |
| pilchard | 1.10 | fish |
| plaice | 6.13 | fish |
| pollock | 1.40 | fish |
| pomfret | 6.63 | fish |
| porbeagle | 11.44 | fish |
| rhombus | 8.41 | fish |
| rock fish | 6.94 | fish |
| salmon | 3.37 | fish |
| sardine | 0.90 | fish |
| sea-bass | 3.60 | fish |
| shark | 11.44 | fish |
| sole | 5.40 | fish |
| swardfish | 12.84 | fish |
| trout | 4.20 | fish |
| tuna | 3.68 | fish |
| turbot | 14.51 | fish |
| whiting | 2.66 | fish |
| cod (f) | 3.03 | fish frozen |
| fish stick (f) | 2.26 | fish frozen |
| haddock (f) | 3.72 | fish frozen |
| herring (f) | 1.30 | fish frozen |
| mackerel (f) | 0.99 | fish frozen |
| mixed fish (f) | 1.04 | fish frozen |
| pollock (f) | 0.90 | fish frozen |
| pollock stick (f) | 2.14 | fish frozen |
| salmon (f) | 1.61 | fish frozen |
| sole (f) | 14.28 | fish frozen |
| trout (f) | 4.38 | fish frozen |
| tuna (f) | 2.64 | fish frozen |
| cod fish stick | 2.14 | fish processed |
| hake fish stick | 2.14 | fish processed |
| makerel fish stick | 1.02 | fish processed |
| tuna in can | 2.10 | fish processed |
| barnacle | 2.30 | shellfish |
| krill | 5.54 | shellfish |
| lobster | 20.25 | shellfish |
| mussels | 0.46 | shellfish |
| cuttlefish | 5.05 | shellfish |
| octopus | 5.80 | shellfish |
| squid | 6.91 | shellfish |
| prawns/shrimps | 7.04 | shellfish |
| octopus (f) | 7.88 | shellfish frozen |
| prawns/shrimps (f) | 15.07 | shellfish frozen |
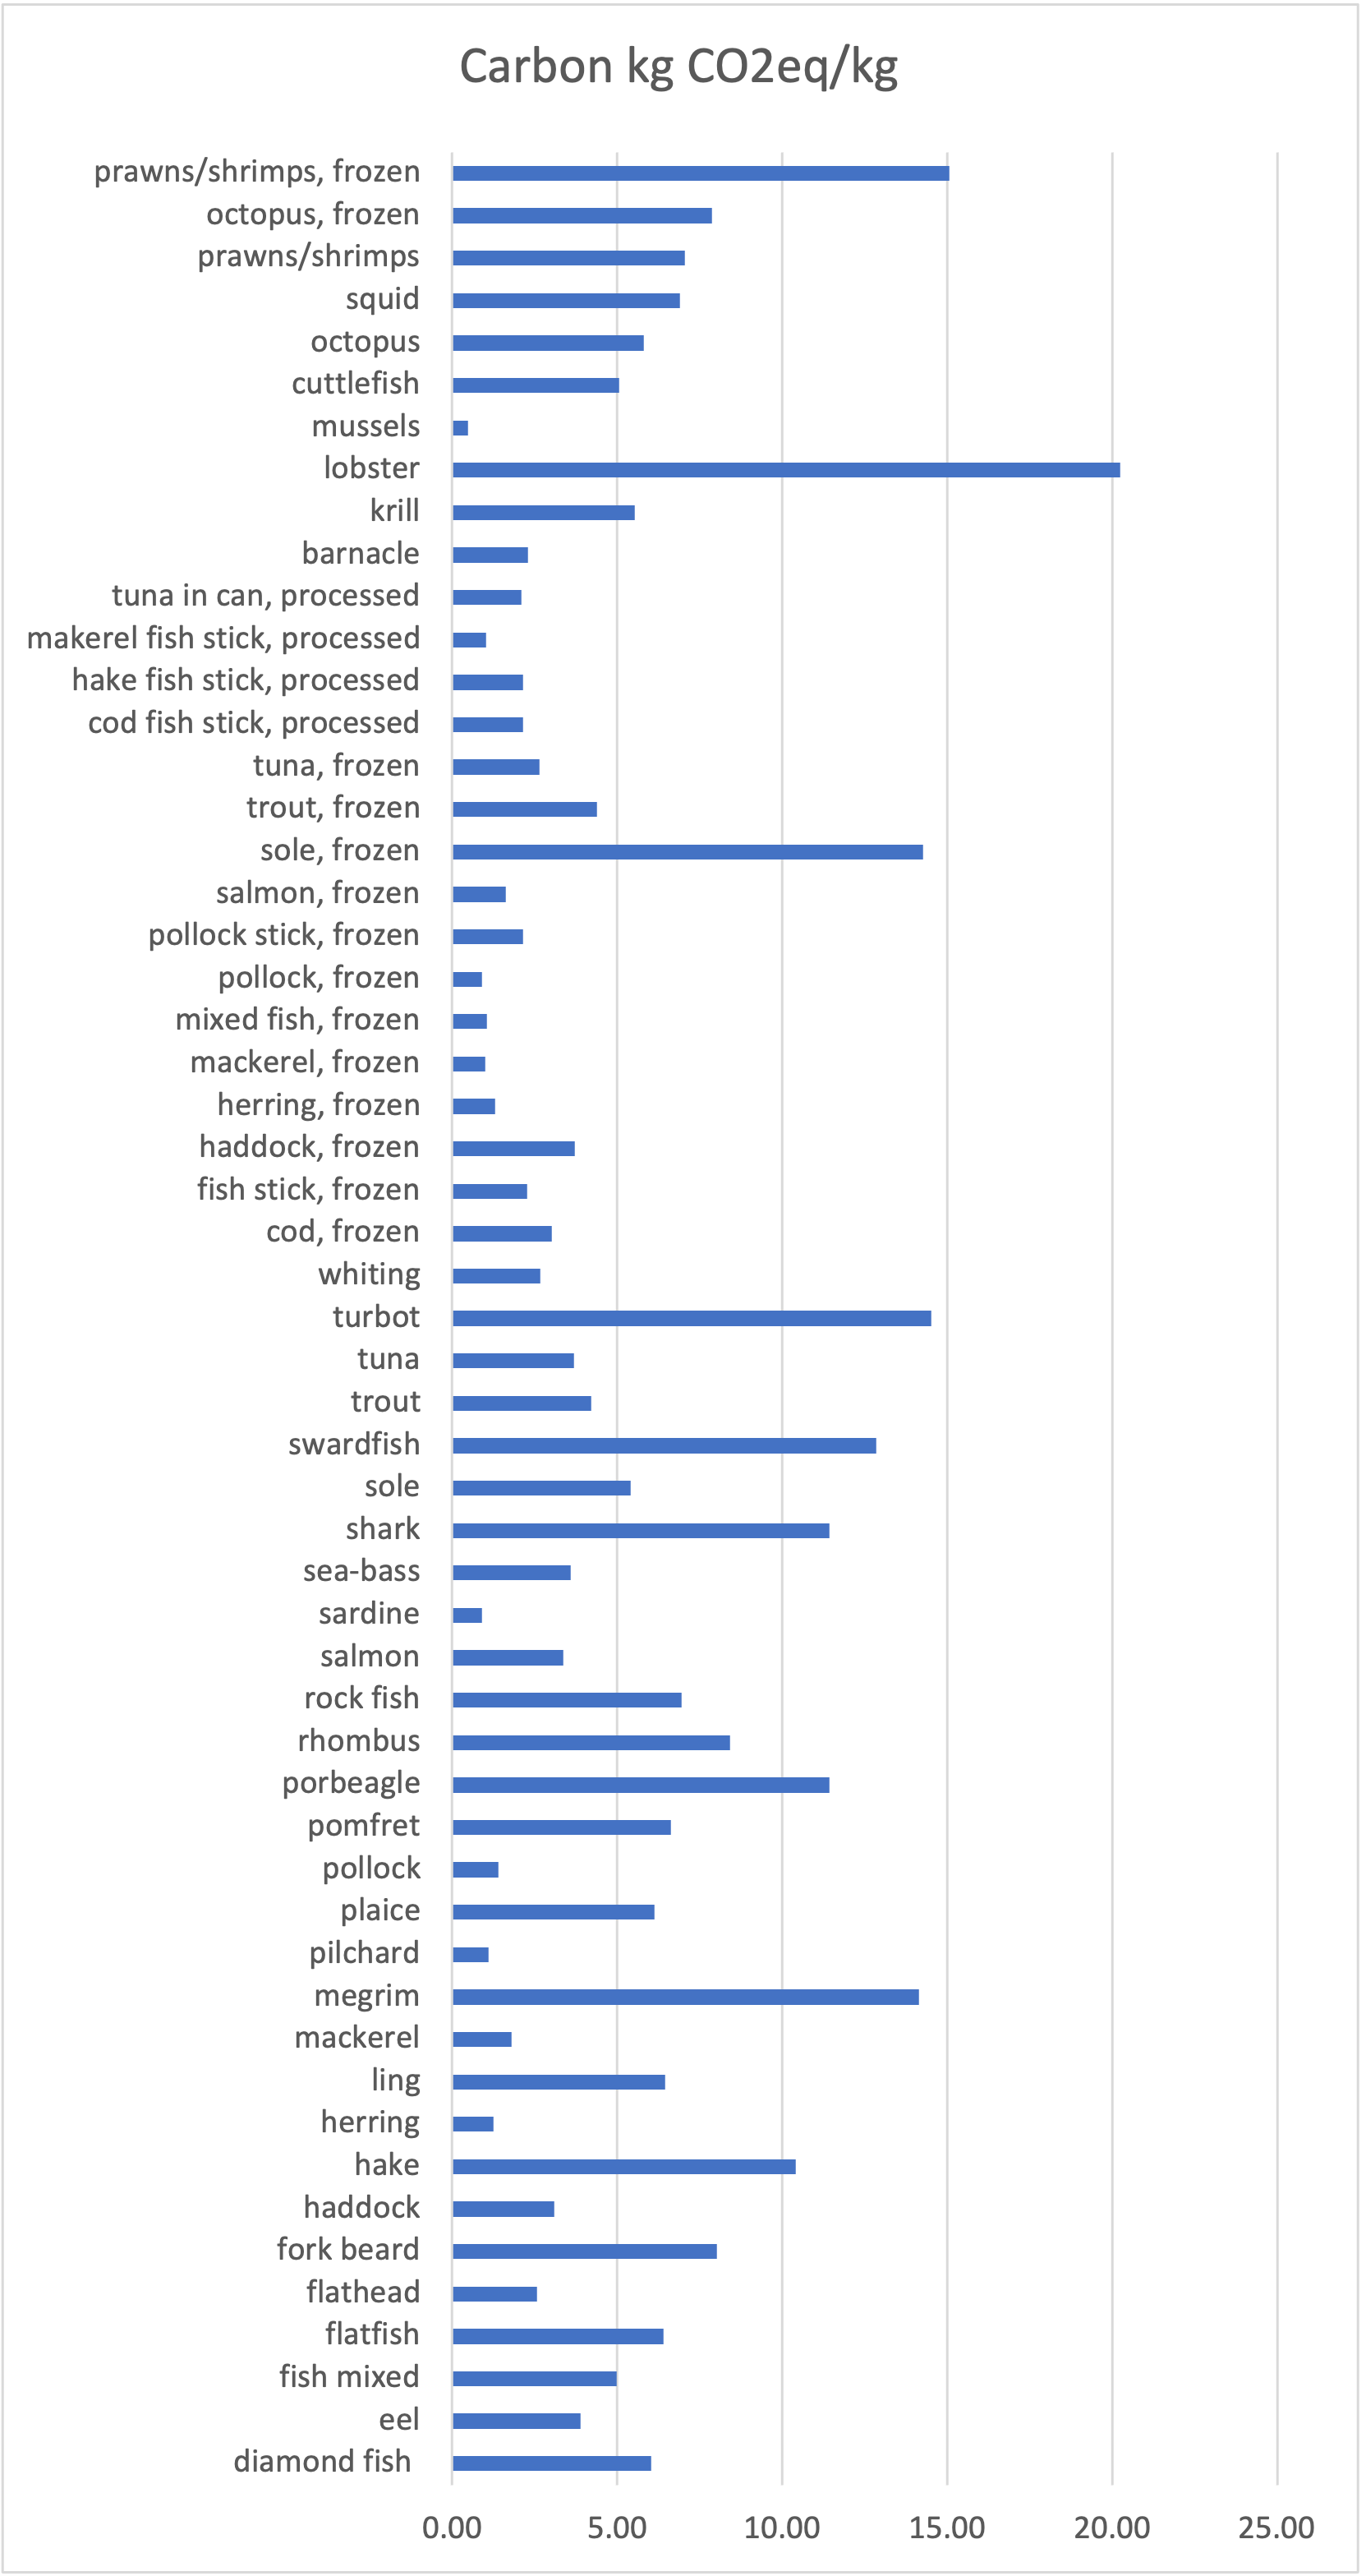
Carbon Footprint Of Fish – Chart

Anne Lauer
Anna Lauer is a writer, gardener, and homesteader living in rural Wisconsin. She has written for Mother Earth News, Grit, and Hobby Farms magazines. Anna is writing a new book about growing your food for free and an ultimate guide to producing food at little to no cost. When she’s not writing or gardening, Anna enjoys spending time with her husband and two young daughters.