Introduction to the Analysis – Economic Carbon Intensity
Our world is in a critical phase where it must balance economic growth with the dire need for environmental sustainability. A key measure of this balance is carbon intensity – the amount of carbon (in terms of CO2 equivalent) emitted per unit of economic output. Typically, carbon intensity is measured in terms of carbon per kilowatt-hour (kWh) of energy produced (prior analysis here). However, this doesn’t tell the whole story. If a country is inefficient at converting energy into valuable goods and services, a low carbon intensity in terms of energy can still result in a high carbon footprint overall.
In this analysis, we aim to investigate a broader measure of carbon intensity – carbon emissions per unit of Gross Domestic Product (GDP). We can call this the “economic carbon intensity”. This measure reflects how effectively countries convert energy into economic value, taking into account both energy efficiency and economic productivity.
Data Sources
Our approach is to use data from two reputable sources. The GDP data is sourced from the Organisation for Economic Co-operation and Development (OECD), which provides reliable and comprehensive economic statistics for countries around the world. The carbon emissions data is sourced from the World Bank, which collects a wide range of environmental and development data. We use data from 2010 to 2020. The last year, 2020 is anomalous due to the COVID19 pandemic, which saw economic output drop and carbon emissions drop at the same time. However, its instructive to include one anomalous point.
Approach
We analyze the relationship between GDP and carbon emissions across all countries for the year 2020. We then fit a regression model to this data, which allows us to compute the “expected” carbon emissions for each country based on its GDP. The deviation of a country’s actual carbon emissions from this expected value (the residual) indicates how clean or dirty its economic activity is relative to what would be expected given its economic size. Countries with positive residuals have higher carbon emissions than expected and are thus “dirtier,” while countries with negative residuals have lower emissions than expected and are thus “cleaner.”
By examining these residuals, we can identify countries that are particularly effective or ineffective at converting energy into economic value. This can provide valuable insights for policymakers, economists, and environmentalists seeking to understand and reduce the global carbon footprint.
In the following sections, we will present the detailed results of this analysis.
USA-Specific Analysis 2010-2020 – Good News
As part of our broader investigation into global carbon intensity, we conducted a focused analysis on the United States. With its significant economic output and considerable energy consumption, the USA serves as a critical case study in the relationship between GDP and carbon emissions.
This analysis aims to provide a clearer understanding of the trends in carbon emissions, GDP, and carbon intensity over the past decade (2010-2020) in the USA. By examining these trends, we can gauge the progress made towards more sustainable and efficient economic activity.
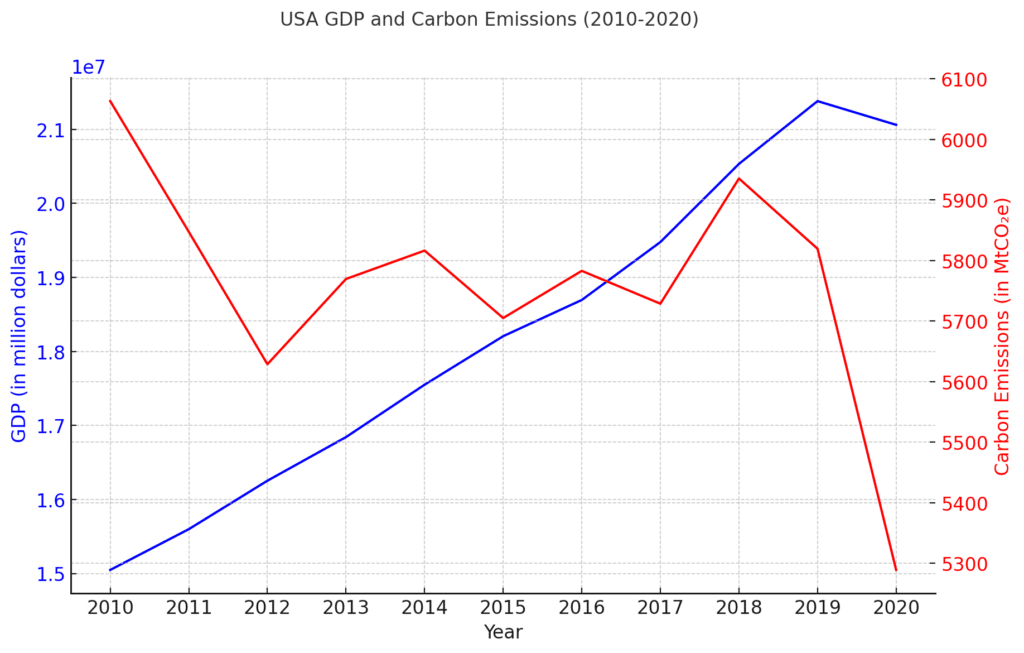
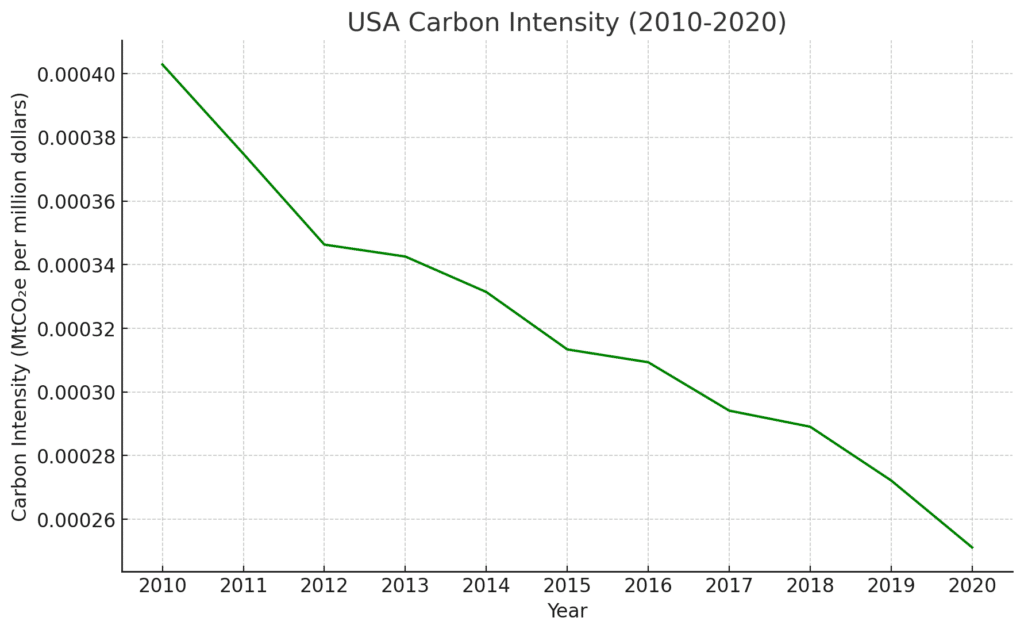
Our results indicate that the USA has made strides in reducing its carbon intensity per dollar of GDP. Despite some fluctuations, the overall trend shows a decrease in carbon intensity over the decade, suggesting an increased efficiency in converting energy into economic value. This is a positive trend, implying that the country is making headway in balancing its economic growth with its environmental impact.
Having established these trends within the USA, our analysis will now shift to a global perspective. We will look at a cross-section of the data from 2020 to compare the carbon intensity of different countries. By comparing these countries’ performance, we can identify those that are particularly efficient or inefficient at converting energy into economic value, providing valuable insights into global carbon intensity.
Detailed Results For All Countries In 2020
Our global analysis begins by examining the relationship between GDP and carbon emissions for all countries in the year 2020. A scatter plot of the data on a log-log scale reveals a general positive relationship: countries with higher GDPs tend to have higher carbon emissions. However, there is a wide range of carbon emissions among countries with similar GDPs. This indicates that factors other than economic size, such as energy efficiency, type of industries, use of renewable energy, and environmental policies, play a significant role in a country’s carbon emissions.
We then fit a regression model to this data, which allows us to compute the “expected” carbon emissions for each country based on its GDP. This model is fit on the log-transformed values of GDP and carbon emissions, reflecting the multiplicative (rather than additive) relationship between these variables on a log-log scale. The results of each country and the trend line are shown here.
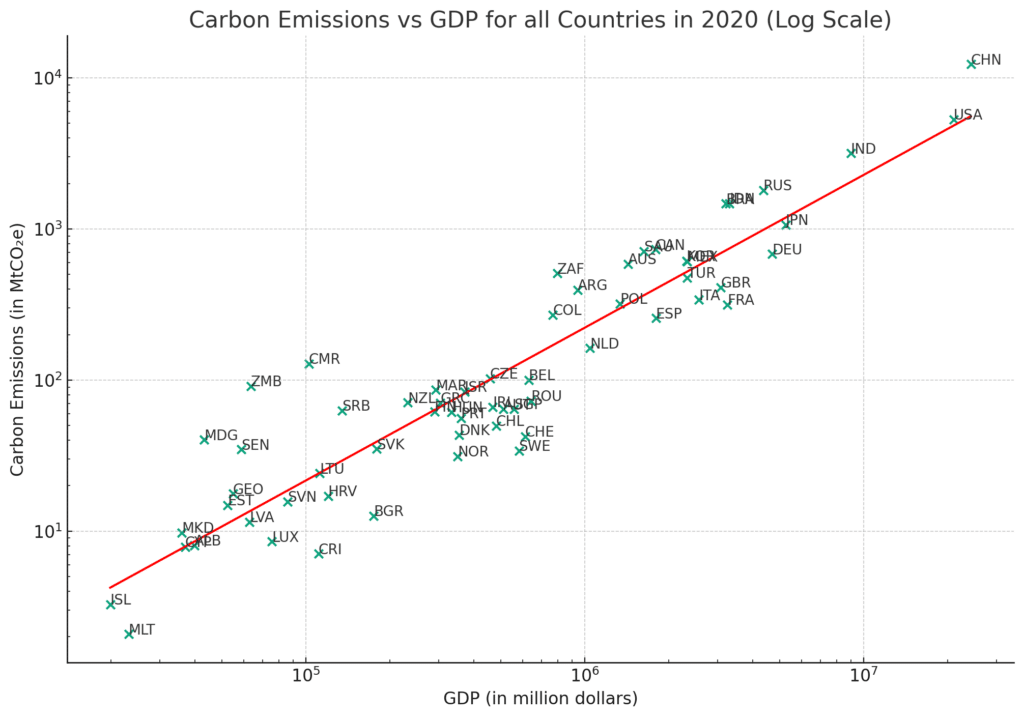
The countries are given by a 3 letter code which for the most part are interpretable. But if you need to find out exactly what each code corresponds to, then you can obtain that from the OECD data download site. We gave the link above.
The residuals from this model (the differences between the actual and expected carbon emissions) reveal interesting patterns. Countries with positive residuals have higher carbon emissions than expected given their GDPs, indicating less efficiency in converting energy into economic value. Conversely, countries with negative residuals have lower emissions than expected, indicating greater efficiency.
Top and Bottom Performers
Our analysis reveals that the countries with the highest GDP in 2020 were China, the USA, and India. However, these countries also had the highest carbon emissions, with China leading by a significant margin. On the other hand, the countries with the lowest GDP (Iceland, Malta, and North Macedonia) had among the lowest carbon emissions, led by Malta with the smallest carbon footprint.
In terms of residuals, China, India, Russia, Brazil, and Indonesia had the highest positive values, indicating higher carbon emissions than expected based on their GDPs. These countries are the “dirtiest” in terms of their economic activity.
On the other end of the spectrum, France, Germany, the United Kingdom, Italy, and Spain had the largest negative residuals, indicating lower carbon emissions than expected. These countries are the “cleanest” in terms of their economic activity.
The Case of the USA
The USA, being one of the world’s largest economies, merits special attention. Our analysis shows that the USA’s carbon emissions in 2020 were approximately 453.36 MtCO₂e higher than what would be expected based on its GDP. This implies that, although the USA is a highly productive economy in terms of GDP, it has room for improvement in reducing its carbon intensity and increasing its efficiency in converting energy into economic value.
Conclusion – Economic Carbon Intensity
Our analysis presents a broad view of carbon intensity in terms of GDP across countries. By examining the residuals from a regression model, we can identify countries that are particularly effective or ineffective at converting energy into economic value. This provides a different perspective on carbon intensity that complements the traditional measure of carbon per kWh of energy produced.
These findings underline the importance of improving energy efficiency and economic productivity in reducing carbon emissions. While economic growth is necessary for development, it should not come at the expense of the environment. Policymakers, economists, and environmentalists can use this analysis as a starting point to explore strategies for achieving sustainable economic growth.
Notes: Data analysis was carried out with the help of ChatGPT and the Code Interpreter plug-in.

Anne Lauer
Anna Lauer is a writer, gardener, and homesteader living in rural Wisconsin. She has written for Mother Earth News, Grit, and Hobby Farms magazines. Anna is writing a new book about growing your food for free and an ultimate guide to producing food at little to no cost. When she’s not writing or gardening, Anna enjoys spending time with her husband and two young daughters.