Your Carbon Footprint Is A Measure Of Your Lifestyle’s Climate Impact.
Almost everything you pay for in day-to-day life causes greenhouse gas emissions. These emissions can be quite obvious, like when you drive a car, or less clear, like those produced to provide a financial service.

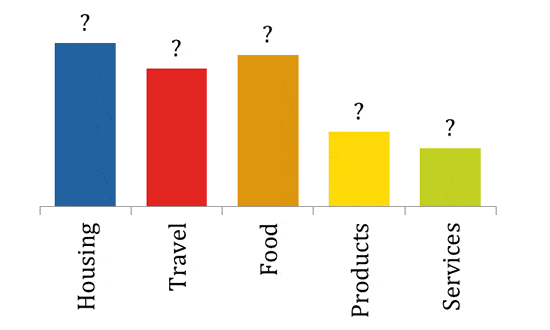
Here at Shrink That Footprint we help people understand their personal footprint by breaking it down into five sectors: housing, travel, food, products and services. By calculating the footprint of your personal consumption you too can create a picture of your lifestyle’s climate impact.
Calculate Your Carbon Footprint First
Before you can understand your footprint you need to calculate it.
Manually calculating your carbon footprint is an excellent way to understand your emissions. If you have the patience for a manual calculation you will learn a great deal about how footprints are generated. For ideas on a method to use check out our calculate your carbon footprint page.
For most people it is far simpler to use an online calculator. Such calculators vary enormously in scope so it pays to look for one that tries to include emissions from indirect sources like food and products, in addition to travel and housing emissions.
Once you’ve done your first calculation you’ll have a rough idea of your footprint. This will help you to understand how your footprint arises and what steps you can take to reduce it.
When you have your footprint it is always useful to see some other examples, to help understand how you measure up.
Examples Of Carbon Footprints
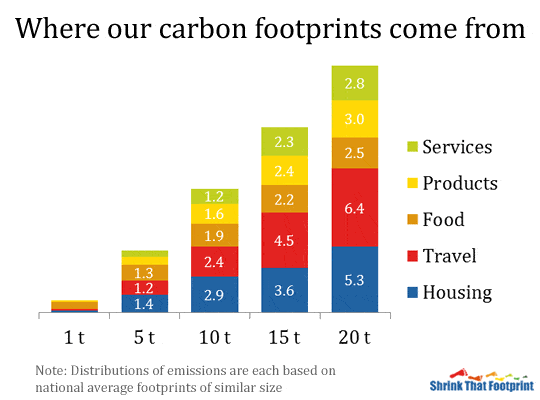
To help give an idea of what different size footprints look like we’ve put together a simple example. This chart shows a ‘typical’ footprint for a 1t, 5t, 10t, 15t and 20t CO2e personal footprint:

Before we start to analyze these footprints, it is important to note that they haven’t been plucked out of thin air. The 20t footprint is similar to an average American, 15t to a Canadian, 10t to a Britain or German, and 1t to an average Indian. The 5t footprint is similar to the global average for 2010.
If we look across these five example footprints a few things a clear:
Food Emissions Are Important Across All Footprints
Though they grow with footprint size their share of the total diminishes. As people get wealthier they tend to eat more animal products, waste more food and eat highly processed foods. Each of these requires more energy and thus adds to the food footprint.
Housing Emissions Also Grow With Footprint Size
But this effect can be less predictable. Although wealthier people tend to have more space and more gadgets, this doesn’t always mean their housing footprint is larger. Because heating and cooling needs are a big driver of housing emissions the local climate has a large effect on a housing footprint. The varying carbon intensity of electricity production in different countries can also have a large effect. While heating and cooling of both space and water are big contributors, there are other major uses of electricity at home that we have broken down for you to consider.
Travel Emissions Are The Easiest Way For A Personal Footprint To Grow Quickly.
Travel is something people spend more on as they get wealthier, particularly holiday travel. Each 3000 miles you drive in a car with average fuel economy will add around a tonne to your footprint. In the case of flying each 8 hours in economy class will also add about a tonne to your travel footprint.
Products Emissions Are Those Produced In The Product’s Life Cycle Up Until It Is Sold.
These emissions occur in raw material extraction, processing, manufacturing and distribution. They tend to grow with disposable income, as people have more spare money to spend on non-essential stuff. There’s a way to get around these by altering your buying habits. For example you really should buy less or buy used. If that’s impossible, we also have a guide for buying eco-friendly especially for single use items like paper towels, cleaners etc that are very hard to avoid. Finally, for the really dedicated there’s a way to get around packaging-related, transportation-related footprints by creating DIY products.
Services Generally Have Low Carbon Intensity Per Amount Spent
But they can make up a large share of spending. In places where people spend a lot on health, educational, recreational and financial services these footprints become quite large.
Because each of the 1t, 5t, 10t, 15t and 20t CO2 examples are based on the average of a large region they look quite similar. Although your footprint may look like one of these, it could easily be very different. If you fly a lot your footprint might be dominated by travel. If you move house and buy a lot of new stuff it could be dominated by products.
If you make the effort to do a detailed calculation you’ll get to see.
Set Carbon Footprint Targets To Track Your Progress
Once you’ve calculated your carbon footprint you are ready to shrink.
To begin with it makes sense to target something big. If you know driving, heating and red meat are your three leading sources of emissions, you could pick one of these and look for ways to reduce it.
In the longer run you may want to reduce your footprint towards a certain goal. Setting such a target is very much up to the individual, but can be done in reference to the broader context of climate stabilisation.
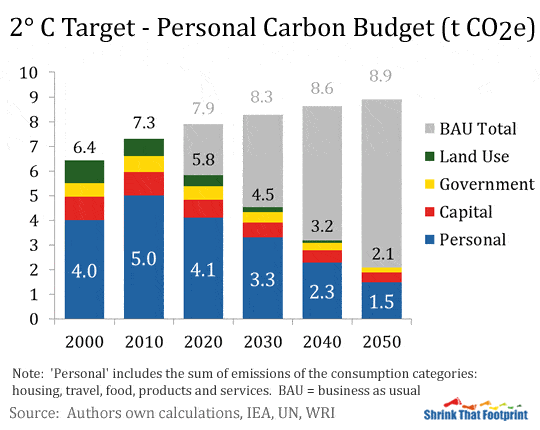
In section three of the The Shrink Guide we looked at carbon targets for your footprint. In this section we showed how you can derive an individual carbon budget which is consistent with limiting climate change this century to 2°C above the pre-industrial average.
It looks like this:

As with anything based on climate modeling there is some inherent uncertainty built in to this budget. Nonetheless it is a good representation of how average personal emissions will need to decrease in order to meet the 2°C goal for this century.
For this budget personal emissions from housing, travel, food, products and services are grouped in a single ‘personal’ category. Individual shares of government, capital investment and land use emissions are also included.
In 2010 average personal emissions were about 5t CO2e. To have a good chance of meeting the 2°C goal these emissions need be reduced by around one tonne each decade to below 2t CO2e by 2050. Although this might seem unlikely, with the right mix of technology and motivation it is entirely feasible. Moreover, for a motivated individual who cares about climate change it is a worthy goal.
Such perspective on global emissions can help you to form your own footprint target. If you’re starting from a footprint over 15t then 10t might be a nice round goal to begin with. From a lower starting point you might aim at 8t or 5t. If you can make it to 5t, then you can start thinking about a globally sustainable footprint of 4t, 3t or 2t.
You’ll never know how low you can go, until you start to shrink.
Lindsay Wilson
I founded Shrink That Footprint in November 2012, after a long period of research. For many years I have calculated, studied and worked with carbon footprints, and Shrink That Footprint is that interest come to life.
I have an Economics degree from UCL, have previously worked as an energy efficiency analyst at BNEF and continue to work as a strategy consultant at Maneas. I have consulted to numerous clients in energy and finance, as well as the World Economic Forum.
When I’m not crunching carbon footprints you’ll often find me helping my two year old son tend to the tomatoes, salad and peppers growing in our upcycled greenhouse.
