A Carbon Footprint Is Aggregate Greenhouse Gas Emissions Related To An Activity
It can be calculated for a product, service, person or even a country, and is used to understand the impact human activity is having on the earth’s climate. This step looks at measuring carbon footprints, personal carbon footprints, national average footprints and the global footprint.
How Are Carbon Emissions Measured – An Example From Burning Gasoline
Carbon emissions can be measured in many ways. One way that we’re quite fond of, and is quite simple conceptually, is to use our knowledge of atomic theory and observations of what happens when we burn fossil fuels. Let’s take gasoline for example. We know that a gallon of gasoline weighs about 6 pounds or equivalently in metric a liter of gasoline weights about 0.77 kg. When the gasoline is burned, the entire weight turns into combustion products which comprise carbon, oxygen, hydrogen, traces of sulfur. The carbon and hydrogen come from the gasoline itself, of which we know 87% is carbon and 13% is hydrogen by weight. The other elements are negligible. The oxygen comes from the air itself.
For 1 liter/0.77 kg of gas, that is 0.67 kg of carbon. That carbon will combine with oxygen in the air. The oxygen atom has a molecular weight of 16 (because its 8 protons and 8 neutrons in the nucleus) which is 16/12 or 4/3 or 133% heavier than the carbon. So in total, if each carbon gets two oxygens to form carbon dioxide, then the total combustion product weight is 0.67 kg plus 2.66 times 0.67 kg which is 2.45 kg of carbon dioxide.

This is an idealized scenario of excellent burning that converts all of the gasoline into carbon dioxide. The reality is that carbon monoxide will also form. We really can’t estimate perfectly because every engine that burns gasoline is different. So the best we can do is estimate with this idealized scenario. We know that the answer isn’t going to be so far off, at worst we’re some percentage away from being correct which carrying out the carbon accounting.
Carbon Footprint Is Measured In Grams Of Carbon Dioxide Equivalent
The standard unit of measurement for carbon footprints is grams of carbon dioxide equivalents (CO2e). The more weight in carbon dioxide you emit, the greater your footprint. The reason for using “equivalents” is because there are other greenhouse gases that trap heat. These other greenhouse gases, while at lower concentrations than carbon dioxide, often have an even greater impact per amount of gas in trapping heat. For example, a single molecule of methane is equivalent to 28 carbon dioxide molecules.
The convenient CO2e unit combines the measurement of six types of greenhouse gasses by weighing them each for their global warming potential relative to carbon dioxide over a period of time, generally 100 years. The gasses included are carbon dioxide (CO2), methane (CH4), nitrous oxide (N2O), perfluorocarbons (PFC), hydrofluorocarbons (HFC) and sulphur hexafluoride (SF6).
Although carbon dioxide is the most important greenhouse gas we measure footprints in CO2e because it helps to better understand the impacts of other gasses, like methane and nitrous oxide. CO2e is the international standard unit of measurement used for greenhouse gas accounting in businesses, countries, carbon trading, and international agreements like the United Nations Framework Convention on Climate Change (UNFCCC). The international standard unit for CO2e is metric tons (tonnes).
Different Techniques Measurements: Emissions Factors, Life-Cycle Vs Input-To-Output
The calculation of carbon footprints can use a number of different techniques. The most common methods are to use emissions factors, Life Cycle Assessment (LCA) or Input-Output Life Cycle Assessment (IO-LCA). Each calculation involves a degree of uncertainty. While footprints from fuel or electricity use can be quite accurate, calculating the footprints of products and services involves a number of assumptions that limit our ability to make precise calculations. Let’s take a look at these 3 in more detail:
Emissions Factors: These are representative values that attempt to relate the quantity of a pollutant released to the atmosphere with an activity associated with the release of that pollutant. These factors are usually expressed as the weight of pollutant divided by a unit weight, volume, distance, or duration of the activity emitting the pollutant (e.g., kilograms of CO2 per gallon of gasoline consumed). These are usually used for straightforward carbon emissions like those from burning fossil fuels.
Life Cycle Assessment (LCA): LCA is a method used to evaluate the environmental impacts of products and services from a holistic standpoint, from the extraction of raw materials through production, use, and disposal. This “cradle-to-grave” approach takes into account all stages of a product’s life cycle. It provides a comprehensive view of the environmental aspects of the product or process and a more accurate picture of the true environmental trade-offs in product and process selection. However, the LCA can be complex and requires detailed data for accuracy.
Input-Output Life Cycle Assessment (IO-LCA): IO-LCA is a form of life cycle assessment that involves economic analysis. It connects industry and product output to environmental impact by considering all the direct and indirect inputs required to produce a certain output. This method is especially useful for large-scale assessments, as it can handle complex supply chains and numerous products. However, its major drawback is that it often relies on average data, which can lack specificity for individual products or processes.
None of these are easy to carry out, by the way!
What Is A Personal Carbon Footprint?
A personal footprint is the emissions caused by an individual’s consumption. It is a measure of how a person’s lifestyle contributes to climate change. By shrinking their personal footprint a person can limit the effect their lifestyle has on the earth’s climate.
Hertwich And Peters Method
Personal footprints can be broken down in to five main categories: housing, travel, food, products and services. These categories capture all the major ways personal consumption can cause greenhouse gas emissions. Drawing on a 2009 study by Edgar G. Hertwich and Glen P. Peters, Carbon Footprint of Nations: A Global, Trade-Linked Analysis, we can examine what a typical personal footprint looks like:
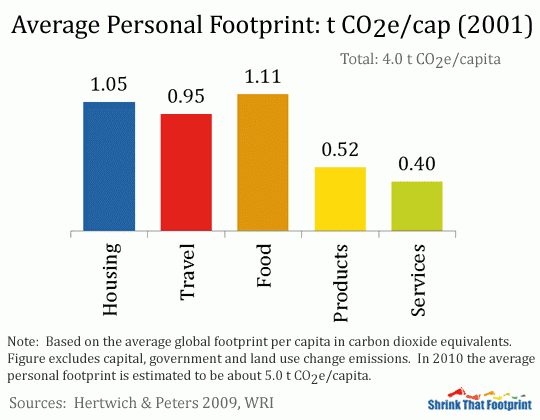
Older Estimates Put A Personal Footprint At 4.0 Tons Of Carbon Dioxide Emitted Per Year
Using data from 2001, the study estimates a global average personal footprint to be around 4.0 t CO2e. The most important categories are housing, travel and consumption which are each responsible for around a tonne per person. Product and service emissions each accounted for around half a tonne. For Americans, the personal footprint is much bigger. On an individual basis the amount is 16 tonnes but the range could be 5-20 tonnes.
Consumption Footprints Are Easier To Think About For Individuals
This calculation is a “consumption footprint“, which is the standard approach we use for calculating individual footprints in this website. Rather than counting emissions by the industries and locations of production, consumption footprints count emissions from the full supply chain.
To complete our understanding of individual footprints we also need to consider two forms of consumption that people do not control directly, namely capital and government consumption. Capital consumption is investment in capital goods. It’s largest components are construction and machinery manufacturing. Government consumption includes things like the civil service, public health care, public schooling and the military.
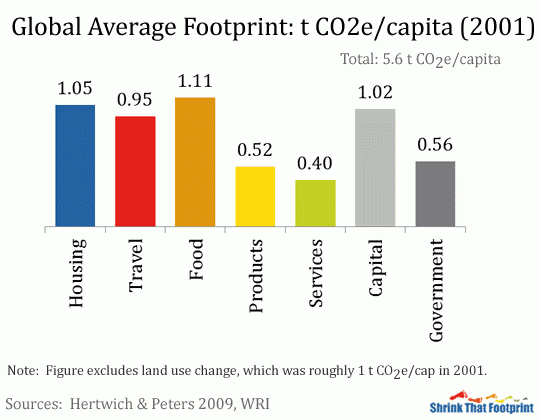
Individuals Have Control Over Their Own Emissions
Although as individuals we have very little control over our share of national capital and government emissions we need to account for these emissions if we want to make meaningful comparisons between our own footprints and international targets. Once we have added the capital and government emissions to the average personal footprint it looks like this. As you can see the addition of Capital and Government emissions brings the total average footprint per person to around 5.6 t CO2e in 2001.
Together these seven categories capture the major ways in which consumption causes emissions, with the notable exception of land use emissions. Land use emissions are the net greenhouse gas emissions that result from land use, land use change and forestry (LULUCF). These emissions are difficult to calculate accurately and hard to assign to final consumption, so they are generally excluded from consumption footprints. They will be discussed more in due course.
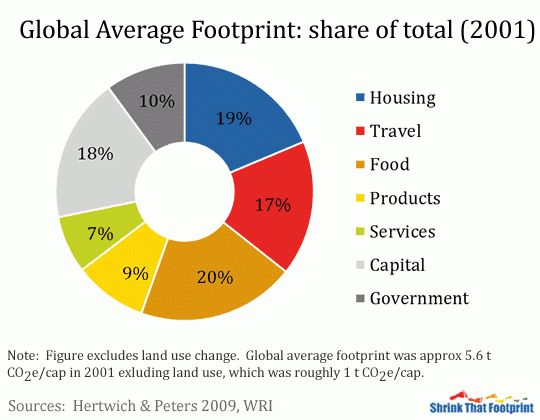
In terms of its breakdown the average consumption footprint looks like this:Personal consumption from Housing, Travel, Food, Products and Services accounts for 72% of the total, Capital emissions 18% and Government emissions 10%. These numbers are naturally different from country to country but personal consumption is invariably the major source of emissions in any country’s consumption footprint.
National Average Footprints
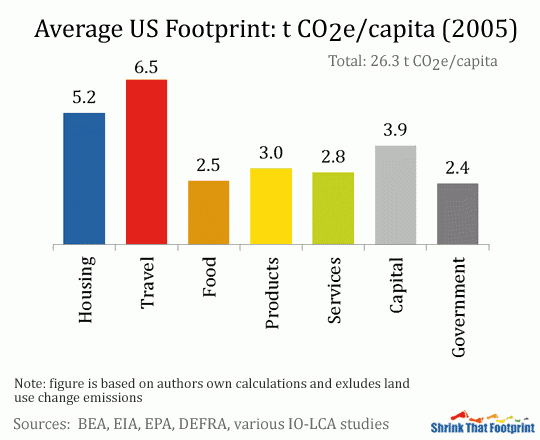
Throughout this guide we will use the average US citizen’s footprint as an example to explain personal footprints. The average US footprint is an excellent example of a large carbon footprint which has the significant potential to shrink. The average American footprint we have calculated is for 2005 and looks like this:A quick glance at this graph tells us that travel and housing are the most important sources of emissions, but that food , products and services are also significant sources of emissions.
Adding In Shared Shared Private And Government Infrastructure Increases The Footprint
The national share of government and capital emissions brings the typical American footprint to 26 t CO2e, which is comparable to a global average of around 6 t CO2e for the same period. The personal footprint alone, excluding capital and government emissions, is 20 t CO2e or around four times the global average.
In steps five to nine of this guide the housing, travel, food, products and services footprints are broken down in more detail to help understand which activities create the most emissions. In each of these steps the breakdown is followed by numerous strategies for shrinking these footprint.
Americans Have A Larger Footprint
Compared to the American footprint, most countries have smaller average footprints. By comparing the national averages of some of the worlds major countries we can see just how varied average footprints are. Unlike in the earlier examples we will restrict our categories to personal, capital and government emissions to keep things simple, all the time remembering that personal emissions are the sum of housing, travel, food, products and services footprints.
We once again use the Hertwich and Peters paper for this analysis, as it is the most comprehensive global study of consumption footprints.
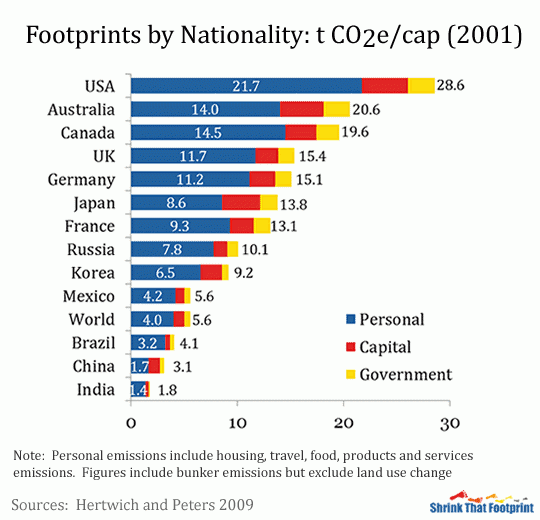
The national average footprints for 2001 look like this:The dominant factor in each country’s average footprint is personal emissions. The personal footprints of people in the US, Australia, Canada, UK and Germany in 2001 all exceeded 10 tonnes per capita. Those in Japan, France, Russia and Korea were between 5 and 10 tonnes. The personal footprints in poorer countries like Brazil, China and India were much more modest, but are growing quickly due to rapid development.
Individuals In The Us Have The Largest Individual Carbon Footprints
In terms of the total footprints the US lead the way with 28.6 t CO2e in 2001, which is slightly more than our own calculation for 2005. This was followed by Australia and Canada, while India was at the bottom with 1.8 t CO2e. In general average footprints are larger in wealthy countries, but there is a still a lot of variation between these countries due to their different consumption patterns. Poorer countries, particularly those in Africa, tend to have very low per capita footprints.
In aggregate the US emitted anywhere from 5.1 billion to 10 billion tons CO2 based on the individual numbers above. As a result of both serendipity and intention, the US has experienced a decline of emissions over the last ten years from 2011 to 2021. This is despite a near doubling of crude oil production due to the shale revolution.
For those interested in a more complete list of countries, including a full breakdown of each nations footprint, the Carbon Footprint of Nations website presents the findings of the Hertwich and Peters paper in an extremely accessible form.
What Is The Global Carbon Footprint
To understand the global footprint we bring together the footprints of all countries and add the land use emissions which are so far unaccounted. We will look at the global footprint in five yearly intervals between 1990 and 2005. As before we break it down into personal, capital and government emissions, while now also adding land use emissions. This total amount measures the global carbon footprint of man made greenhouse gas emissions.
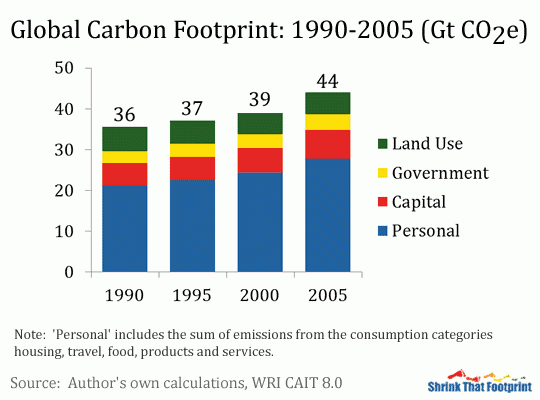
As we can see global emissions grew relatively slowly from 1990 to 2000. The large growth between 2000 and 2005, from 39 Gt to 44 Gt was in large part due to economic growth in the developing world, in particular China. With the inclusion of land use in the global footprint the distribution between the sectors is roughly 62% for personal, 15% for capital, 15% for land use, and 8% for government emissions. This breakdown is relatively stable across the periods, although the land use share declines slightly over time, while capital emissions are increasing due to rapid growth in places like China, India and Brazil.
Land Use Emissions Include Both The Addition And Removal Of Emissions To The Atmosphere
Land use emissions are the result of human land use, land use change and forestry (LULUCF). The statistics we have used come from the World Resource Institute, and estimate that land use emissions have declined slightly between 1990 to 2005, from around 6 Gt to 5 Gt CO2e. The estimation of land use emissions is difficult and has large margins of error associated with it. According to the data more than half of net land use emissions globally in 2005 occurred in Brazil and Indonesia, due largely to deforestation caused by beef and palm oil production respectively.
As with government and capital emissions, individuals have limited control over land use emissions. Despite this challenge we include them in the total to get a proper perspective of the global footprint. Their inclusion is also a good reminder of just how important land use emissions are, and why we need global action to protect forests from degradation.
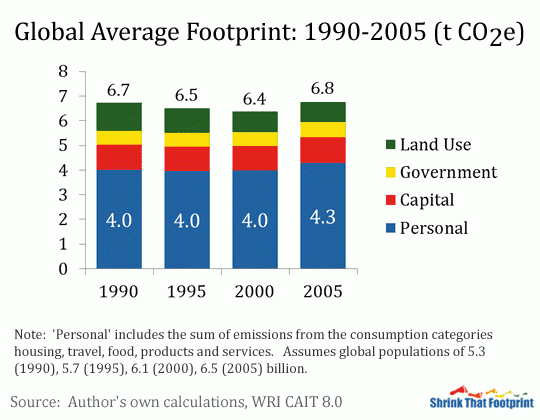
Because this is a global footprint we can simply divide the totals we have by global population in each year to estimate the global average footprint.Here we see that there was virtually no growth in per capita emissions between 1990 and 2005. Average per capita emissions failed to rise because population growth was roughly similar to emission growth over this period, with population rising from 5.3 to 6.5 billion. Personal emissions were also pretty much level at 4t per capita for the first three periods, before jumping slightly to 4.3t in 2005. We expect this growth to have continued between 2005 and 2010, though it takes a few years to collect the full data.
Summing Up
In this step we defined what carbon footprints are and the way we measure them using a consumption approach.
We showed how to separate personal footprints into five categories: housing, travel, food, products and services. And how this process helps to understand the climate impact our lifestyle has. We used the global average footprint, an American footprint and national averages to give us some perspective of a footprint’s typical size and breakdown. And finally we analysed the global footprint, both in terms of total and per capita emissions.
In the next step we talk about climate change.
Lindsay Wilson
I founded Shrink That Footprint in November 2012, after a long period of research. For many years I have calculated, studied and worked with carbon footprints, and Shrink That Footprint is that interest come to life.
I have an Economics degree from UCL, have previously worked as an energy efficiency analyst at BNEF and continue to work as a strategy consultant at Maneas. I have consulted to numerous clients in energy and finance, as well as the World Economic Forum.
When I’m not crunching carbon footprints you’ll often find me helping my two year old son tend to the tomatoes, salad and peppers growing in our upcycled greenhouse.