Introduction – What Is A Product Footprint
A person’s product footprint is the sum of all the footprints of products they purchase. The best way to assess this footprint would be to add together the footprints of each product, as determined by a life cycle assessment (LCA). To do this however one would need a complete list of every purchase made in a year and a LCA for each one of those purchases.
Such a list isn’t practical and while LCA is becoming more common, it is still only available for a small share of products. After assessing this list, consider what you can substitute for the products that reduce your carbon footprint. We go into more detail in this guide on buying eco-friendly items.
We’ve also covered categories of products that reduce waste. See this section on bamboo household products, super helpful because of the sustainable source material. See this section on using an alternative to plastic wrap, beeswax wrap.
Product footprints are the most difficult part of your footprint to understand.
Product emissions arise from long supply chains that we have little influence over, so our ability to reduce them is mostly limited to purchasing decisions. In this step we analyse what a product footprint is, the carbon intensity of products, alternatives to new products, low-carbon design and recycling. Note that it’s not enough to say a product is made from recycled products or is biodegradable. These don’t factor into our calculations.
For example, when we discuss sustainable diapers we clarify that going to a landfill does nothing for carbon emissions, and the only criterion for something as difficult to manage as diapers is that they be sourced from a renewable material like farmed forests or bamboo.
The IO-LCA makes the carbon intensity estimate into a question of spend
The best way available to get around this problem is to use Input Output Life Cycle Assessment (IO-LCA). Using sector level data IO-LCA estimates the average carbon intensity of spending in different areas of the economy.
It does this by assessing the economic activity created by different types of spending, and then estimating the emissions associated with that activity. IO-LCA is fast and practical but relies on broad sector level averages for both prices and carbon intensities. So the while it works well in large samples it may not be very accurate for a specific product.
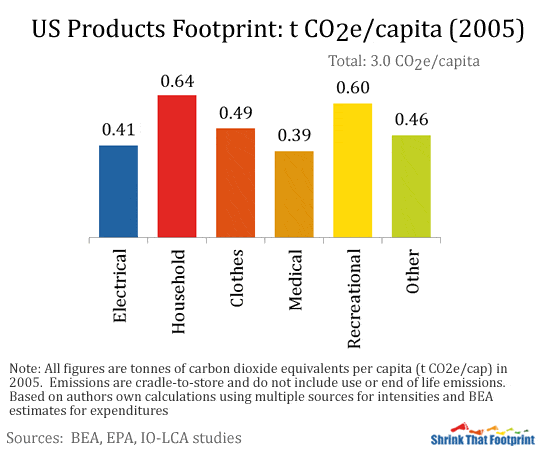
Using some averages from different US and multi-regional studies we can estimate an average US citizens products footprint. We do this by splitting product expenditure up into different groups: electrical, household, clothes, medical, recreational and other. By estimating IO-LCA data for the average carbon intensity of spending in each group we can produce a footprint for a typical American’s products footprint.
Our estimate looks like this:
Each one of the product carbon sources can be mitigated. For example, people get clothing from vintage stores to avoid production carbon costs and landfill emission costs. Encouragingly, consumers are more favorable to the concept of sustainable fashion and sustainable clothing which our website also talks about quite a bit.
Average US Products Footprint Is Given By 3 tons Of CO2e.
This footprint is quite evenly spread across the different product groups because spending is also quite even between the groups. The main variation is driven by the higher carbon intensity of production in some groups.
In terms of each of the product groupings it is worth better explaining what is included:
Electrical: appliances, audio-visual, electronics, gadgets
Household: furniture, linen, kitchenware, supplies
Clothes: apparel and footwear
Medical: medicine, personal care, tobacco
Recreational: bikes, sports equipment, car parts
Other: books, newspapers, jewelry, luggage
Because so many products are aggregated into each sector it is hard to generalise about what the major sources of emissions are in each case. Depending on their shopping habits any given American’s own footprint could look vastly different to this one. This is particularly true because many large purchases, like furniture and appliances, only happen occasionally but can have very large footprints.
In terms of percentages the breakdown looks like this:
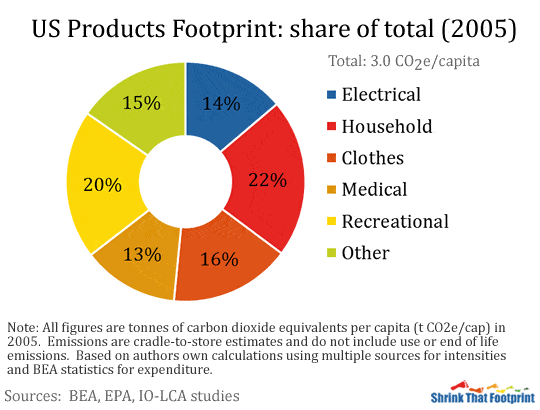
Again there are no particular sectors which standout greatly. Household (22%) and recreational (20%) are the largest sectors but clothes (16%), other (15%), electrical (14%) and medical (13%) are all significant. One of the challenges of this approach is that by grouping so many products together the results become quite homogeneous. Researching individual products can help to overcome this problem. As sophisticated end products tend to be more expensive, there’s a drive to create DIY versions, for example the unavoidable yoga mats that everyone is carrying around with them, we put together a DIY homemade yoga mat version to reduce the product carbon footprint.
To further improve our understanding of product footprints we will look at the two main ways you can assess your own products footprint.
How To Calculate The Carbon Intensity of Products
The great variety of materials, manufacturing and distribution methods used for different products makes assessing their carbon footprint very difficult. The two best options for analysing your products footprint are to use a ‘spending approach’ or a ‘process approach’. We will look at each in turn.
Spending approach
The approach used in our examples so far has been to assess the average products footprint based on the carbon intensity of spending in different groups. These carbon intensities are based on different US and international studies that use input output models (IO-LCA).
The estimated carbon intensities for each of our six product groups are as follows:
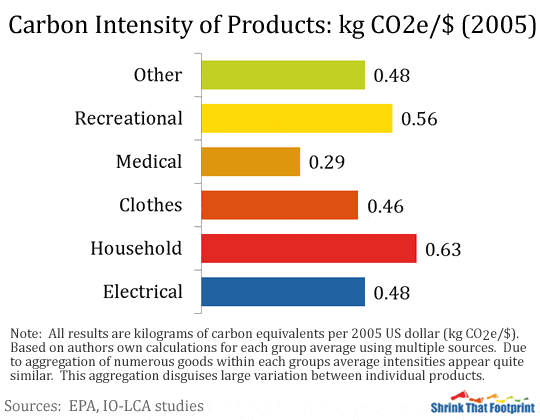
Because these intensities are estimated for groups which contain a huge number of different products they aren’t particularly accurate for any given product. They are however a great starting point for understanding how we can use expenditure to calculate footprints. The weighted average for spending across all six groups is 0.47 kg CO2e/$, so roughly every two dollars spent on products in 2005 resulted in 1 kg CO2e of supply chain emissions.
The Difference Between Each Group Reflects How Carbon Intensive Their Production Is Relative To Final Price.
For example, household goods like linen and furniture are often carbon intensive to produce but relatively inexpensive, resulting in high carbon intensity per dollar spent. The opposite is true of medical spending in which expensive things, like medicines and personal care products, are less carbon intensive to produce thus resulting in low-carbon intensity per dollar spent.
Applying average intensities like the ones above is effective for broad calculations at a national level, but limited for individual products. To use this approach for specific products one needs access to a full IO-LCA model. Such models often have hundreds of sectors and have been developed by academics in many countries including Japan, Germany, the UK and US. A European wide model is currently being developed in the EXIOPOL project.
Input-output models estimate the carbon intensity of output from each sector in terms of carbon intensity per unit currency, whether it be Euro, Yen, Pound or Dollar (kg CO2e/$). Using such a model you can estimate a products footprint based on its price.
Let’s say such a model tells you that the carbon intensity of television manufacturing is 0.5 kg CO2e/€. So if you spend €1000 on a TV then the estimated footprint is 500 kg CO2e. Across the whole economy this may be a good estimate but it assumes average production and average prices, both of which are potentially large source of error.
The spending approach is most effective when considering entire product groups and large amounts of expenditure. This makes it excellent for analysing industry wide or national level footprints, but less useful for analysing specific products.
A Process Approach
The alternative approach for understanding a products footprint is to use a process based life cycle assessment (LCA). LCA analyses the emissions involved in each process of a product’s life cycle. In many cases this is across the full life cycle from cradle-to-grave. This is in contrast to the system boundaries of the spending approach which tend only to look at emissions up until a product is sold.
The easiest way to think about LCA is in terms of the different stages of a product’s life: materials, manufacture, distribution, use and disposal. The idea this life forms a cycle is clearer visually:
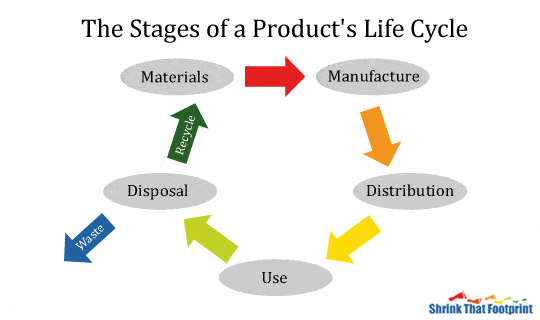
Life Cycle Assessment Studies All The Inputs And Outputs In Each Stage Of A Product’s Life.
When looking at the full lifecycle it is often called cradle-to-grave analysis. It normally defines a functional unit, like a single product, and then assesses the emissions associated with this units life cycle for a defined system boundary.
Life cycle assessment is the method of choice for businesses who wish to understand the carbon footprint of their product and find ways to reduce it. Although many company studies are kept private there is a growing trend in business to highlight eco credentials by displaying the improvements in footprints manufacturers are achieving.
A good way to further understand what a LCA tells us is to compare a few examples:
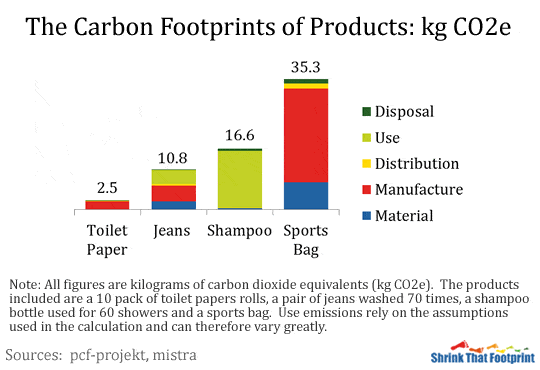
Our examples here are a 10 pack of toilet paper, a pair of jeans washed 70 times during its life, a bottle of shampoo used for 60 showers and a sports bag. The toilet paper and sports bag are quite intuitive; they are both dominated by manufacturing emissions. In the bags case this is things like spinning, weaving, dyeing and finishing the bags fabric.
Similar processes are responsible for around 40% of the jeans footprint with around a further 20% for the material production. Ways to address these production costs, which we mention just briefly here because that’s not the point of this article, are to come up with zero-waste alternatives, like substituting for plastic bottle alternatives.
The Use Phase Of A Life Cycle Analysis Is Often The Most Confusing.
In this jeans examples the emissions resulting from washing and ironing make up 40% of the footprint. But this calculation requires a huge number of assumptions including how many times it will be washed, at what temperature, how full the machine is and how carbon intensive the electricity used is.
As such the use phase of any life cycle analysis should always be viewed cautiously. It can be useful for product design but may be different from how it is actually used. The shampoo is an extreme example of this, the use phase includes all the energy need for 60 showers and makes up more than 90% of the footprint.
Our calculation method using spending keeps the emissions from the use and disposal of products in the housing footprint, in terms of electricity and waste emissions. This avoids double counting use emissions, as well as inaccurate assumptions about usage or disposal.
In our calculator we would only include product emissions from materials, manufacture and distribution. These totals are 2.4 kg CO2e for the toilet paper, 7.0 kg for the jeans, 0.6 kg for the shampoo and 34.1 kg for the bag.
The Process Approach Is Preferable To Using The Spending Approach
Because it avoids using prices which can vary greatly. In an ideal world we would have a LCA estimate for all of the products we buy over the course of a year. Unfortunately such life cycle assessments are still rare, so the spending approach is the natural fall back for assessing your full products footprint.
The complex nature of product footprints means that neither a spending or process approach is perfect. By using a combination of the two you can both estimate your own products footprint and understand how you might reduce it.
Alternatives To New Products
The simplest way to reduce your products footprint is to buy fewer new products. By avoiding the purchase of a new product you avoid the emissions associated with sourcing materials, manufacturing and distribution. Although many alternatives to new products aren’t always practical, or desirable, they can sometimes make a lot of sense. We will look at three possibilities: less stuff, used goods and shared ownership.
Have Less Stuff
Having less stuff is sure-fire way to buy fewer products. Though many products improve our lives and afford us status with friends, they can just as easily be a source of distraction, financial stress and clutter. Having less stuff can often result in more time and space for the things you enjoy in life.
One way we suggest to achieve less stuff is to make your own stuff, i.e. DIY and homemade products. Good examples are making your own cleaning agents and your own household supplies.
Beyond basic necessities like clothing, linen, furnishings, appliances and hygiene products, there is much potential to reduce our consumption of products. Anything you buy that quickly ends up in storage and is rarely used has a footprint that could have been easily avoided. Whether it is kitchen appliances, clothing items or electronic gadgets, buying less stuff will help to reduce your products footprint.
How effective material simplicity is as a strategy for you will depend very much on how much you like your stuff. However, even if you really get a kick out of owning new products by focusing on quality rather than quantity you could reduce your products footprint. Although a simplicity approach has obvious limitations it is a logical first step to consider in any attempt to reduce you products footprint.
Buy Used Goods
Buying used goods or extending the lifespan of ones you own is a great way to reduce your products footprint. Each time someone buys, is given, repairs or reinvents an existing product it avoids the emissions that would have occurred if they had bought a new product. With the exception of some old appliances that are very inefficient in their use phase, extending product life spans is an effective way to reduce your footprint.
How practical choosing a used good over a new one is depends very much on the type of product. It obviously isn’t much use for non-durable goods like cleaning and hygiene products. Quality clothes and fashion items on the other hand can have great value to someone else when the owner has grown tired of them which has spawned a whole area of vintage fashion and also sustainable clothing. Obviously that won’t apply so well to certain items, like socks, underwear or linen.
In turn think about when you no longer need a product. Consider donating things like clothes and toys to the Salvation army or giving it to a swap shop.
Keeping Appliances For Longer
Repairing them when they fail or buying them second hand can be very successful, particularly in cases where the appliance is not in constant use. The fast advancement of technology for computers and phones means buying second hand goods or repairing older ones isn’t always very desirable.
Perhaps the greatest potential for choosing used goods over new ones is for things like furniture, tools and recreational equipment. Pre-loved tables, chairs, couches, power tools or bicycles can be very high quality, and reasonably priced. Trade in such goods has been made easier by the Internet. Sites like eBay and Craiglist make finding and redistributing second hand goods far easier. There are also many platforms to swap or give your goods away.
It’s not just appliances, but things like clothes too. Instead of throwing them away, refurbish them by making them soft again.
Go For Shared Ownership
A third way to avoid the emissions that result from buying new products is shared ownership. Shared ownership is not a particularly revolutionary concept, just think of the numerous types of products you can hire like tools, books, films or bikes. By spreading access to a product across numerous consumers shared ownership uses goods much more efficiently than if they are owned individually. This avoids a great amount production and the associated emissions.
In choosing to share or hire a product rather than own it there is a trade-off between the convenience of having it to hand at any moment, versus the cost of not having to buy it. Naturally this means shared ownership lends itself to certain products and not others. Those products which are not used that often, and expensive to buy, are obvious candidates. Traditional examples are launderettes, libraries, tool and car hire.
Shared economy has grown
On top of these traditional businesses the Internet has helped to broaden the boundaries of shared ownership, both in terms of products available and ownership models. Businesses are renting more and more types of products, and peer-to-peer platforms are providing the chance for individuals to share their own products with others in order to make some cash. Some leading examples of shared ownership are the membership models for bicycle and car use that are becoming popular in big cities around the world.
By owning less stuff, buying used goods and sharing ownership you can significantly reduce your products footprint. In cases when none of these options are practical you can still limit your footprint by choosing products with low-carbon designs.
Buy products with low carbon design
Although it is a gradual process, companies are beginning to take the carbon footprint of their products seriously. By assessing the life cycle of a product through each phase of its life cycle a company can highlight where most emissions occur and seek to reduce them.
Regardless of when the majority of a product’s emissions occur, reducing them comes back to a question of design. For materials this may be a case of using less of a material, substituting it with a less carbon intensive alternative or sourcing recycled materials. In the manufacturing phase a simplified design can reduce energy needs. While accessing lower carbon energy can limit emissions per energy input. For distribution smaller packaging, lighter weight and alternative freight choices can all reduce emissions. And in the use phase intelligent design can reduce a products energy needs and make it more durable. Finally the choice of materials and design for dis-assembly can improve the recycling of a product when it reaches the disposal stage.
Low-carbon design has taken hold in electrical products
A combination of improving technology, government mandates and rising electricity prices has resulted in the electrical goods industry radically improving the energy efficiency of products.
To make these ideas seem a little more tangible it is useful to use an example. We will look at some of the famous Apple products. For a few years now Apple have produced reports about their product’s environmental performance, including their carbon footprints.
The following graph summarizes a few of them:
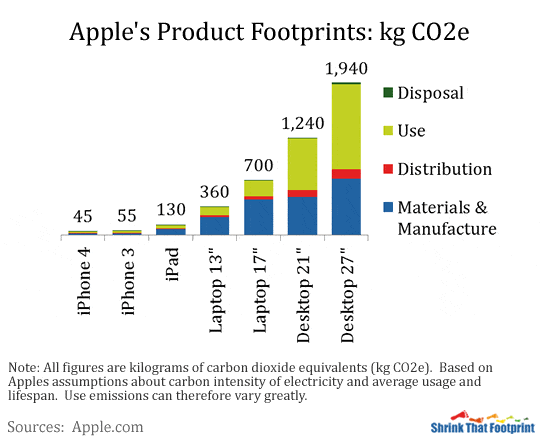
This graph compares some of Apple’s most important products, namely its iPhone, iPad, laptop and desktop computers. Although the assumptions used for the use phase vary from product to product, the correlation between physical size and overall footprint is quite clear. Adjacent products include phone cases, carrying bags, cords, chargers. New cases like Pela cases are compostable meaning that even accessories are being made sustainable.
Desktop computers in particular have larger footprints than laptops, due to materials, production and as a result of the greater electricity needs of their bigger screens and processors. The same effect is seen between the 13″ and 17″ laptop. The smaller iPhones and iPad have significantly lower footprints. Indeed the improvement between the third and fourth generation iPhone is typical of much of the electronics industry over the last decade in which companies have managed to reduce product footprints while improving their performance.
Companies release this information to the public for good PR
Although many companies use their product footprint studies for internal purposes only, it is becoming more and more common to release this information to the public as a form of marketing. Such information not only helps inform purchasing decisions but adds to the general understanding of product footprints. Greater consumer understanding and demand for low-carbon design can only help to improve this.
For the vast majority of purchases you won’t have much information to help you compare product footprints. Without proper data all you can do is use your common sense to think about a product’s life cycle. Learning about the carbon intensity of different materials, manufacturing processes, packaging and distribution can help to inform your purchasing decisions. As we explained earlier, product footprints are perhaps the most difficult footprints to calculate, so don’t be discouraged if you find assessing your own purchases difficult.
The future is carbon neutrality
The ultimate evolution of low-carbon design would be to design products that are carbon neutral across their life cycle. Although this is very difficult in practice, due to the energy embodied in each life cycle phase, it is a compelling goal perhaps best captured by the idea of ‘cradle to cradle’ design.
In terms of material efficiency cradle to cradle design is a move away from the constant through put of virgin materials to recycling and reinvention, hence avoiding many emissions associated with material extraction and waste. While actual applications of cradle to cradle production may be limited, the concept as a goal is a powerful one. Rather than trying to gradually improve the problems of material waste this idea looks to fix it completely by closing the loop.
In the context of product footprints the recycling of materials together with the use of low-carbon energy for manufacturing and distribution has the potential to hugely reduce a product’s footprint. While zero footprints may not be achievable, large reductions are certainly possible.
Recycling
Having reduced your products footprint by choosing alternatives to new products and low-carbon designs where possible the last thing to remember is to recycle a product when it can’t be used any more. For many materials the difference in carbon intensity between virgin and recycled sources can be enormous. By recycling a product you can help to reduce the carbon intensity of new products while also reducing landfill or incineration emissions.
The value of recycling material varies greatly both in terms of carbon intensity and in their ability to be re-processed without losing quality. Materials that are very carbon intensive to produce in virgin form are often the most useful to recycle, aluminium is a classic example.
The following graph compares the carbon intensity of virgin and recycled sourcing for some common materials.
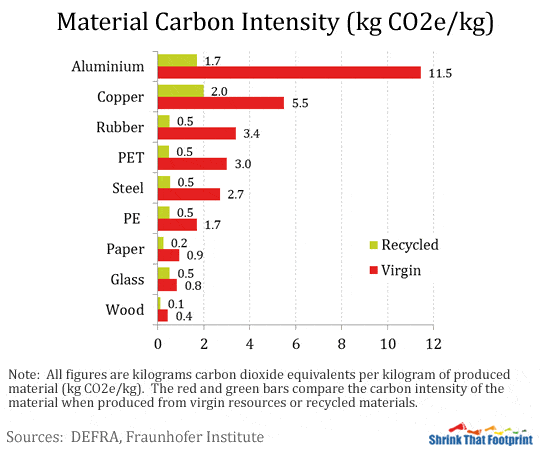
All recycled materials achieve carbon savings of 60%
In absolute terms recycling a kilo of aluminum makes the biggest carbon saving of the materials listed, but all of them with the exception of glass, achieve carbon savings of at least 60% compared to virgin resources. The purer and more easily separated the material the better.
The secondary benefit of recycling is avoiding emissions from landfill or incineration. In terms of typical household waste, recycling is significantly less carbon intensive than either landfill or incineration. This holds for almost all materials with the exception of kitchen or garden waste. Products and packaging made of paper, plastics, glass and metals are often readily recyclable.
Due the twofold benefit of supplying low-carbon materials and reducing waste emissions recycling makes a great deal of sense. By ensuring your products, packaging and waste are properly recycled you can help make it easier for other people to reduce their own product footprints.
Summary
In this step we have seen how a person’s product footprint is the sum of the footprints from each new product they buy. We have focused on the challenges of assessing these footprints accurately using a spending or process approach. We have explained that having fewer products, buying used ones and sharing products can avoid the emissions associated with new production. Finally we have looked at the potential of low-carbon design to reduce the footprints of new products, and explained the twofold benefits of recycling.
Lindsay Wilson
I founded Shrink That Footprint in November 2012, after a long period of research. For many years I have calculated, studied and worked with carbon footprints, and Shrink That Footprint is that interest come to life.
I have an Economics degree from UCL, have previously worked as an energy efficiency analyst at BNEF and continue to work as a strategy consultant at Maneas. I have consulted to numerous clients in energy and finance, as well as the World Economic Forum.
When I’m not crunching carbon footprints you’ll often find me helping my two year old son tend to the tomatoes, salad and peppers growing in our upcycled greenhouse.
