US carbon emissions are down 12% since 2005.
According to many an editorial the reason is simple. The fracking boom has driven out coal.
But that isn’t what the data says. The data says that oil emissions are down more than electricity emissions. That natural gas is at best responsible for half of emissions cuts. And that electricity generation tell us only half the story.
If we want to really understand what happened to US emissions we also need to ask why oil emissions have tanked.
America’s Carbon Cliff
Using the charts from our recent report ‘America’s Carbon Cliff: Dissecting the Decline in US Carbon Emissions‘ this post is going to try to explain what happened to US carbon emissions between 2005 and 2012.
We’ll start with a macro overview of what happened at the national level, then take a closer look at the changes in each sector and finish with a discussion of oil consumption.
For a more detailed explanation of each chart check the full report.
Four Ways To Dissect The Decline
Energy related carbon emissions in the US declined about 12% from 2005 to 2012, or roughly 700 Mt CO2.
The decline in total emissions has been widely documented. In the context of the last fifty years it looks like this:
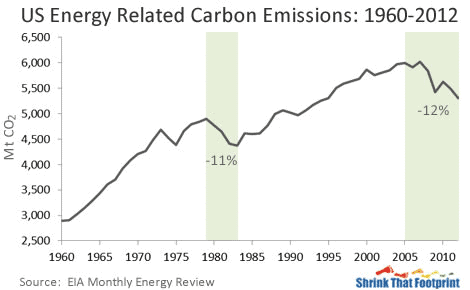
The drop in carbon emissions in the last seven years has been even greater than occurred from 1979 to 1983.
The carbon cut is even more impressive if you look at it per person:
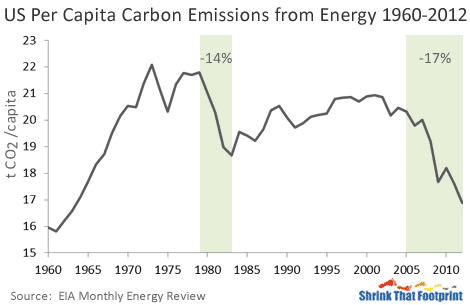
American’s per capita emissions are down 17% since 2005, to their lowest level since 1963. Although still high by international standards the scale of this drop is unmatched in the last 50 years.
Another way to think about these emissions cuts is in terms of fuels:
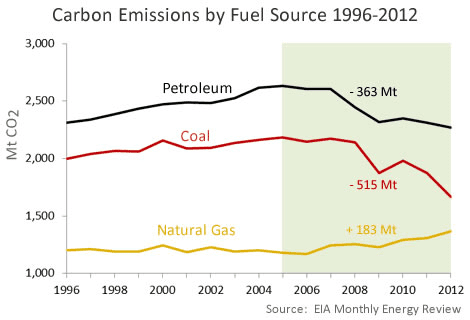
Between 2005 and 2012 coal emissions dropped by 515 Mt, petroleum emissions fell 363 Mt and natural gas emissions grew by 183 Mt.
Although coal’s decline made the biggest contribution to emission cuts the majority of coal was displaced by natural gas. In contrast much of the drop in oil emissions was simply due to destroyed demand.
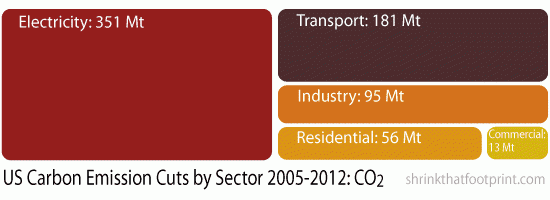
An even more useful way to think about emissions is in terms of sectors:
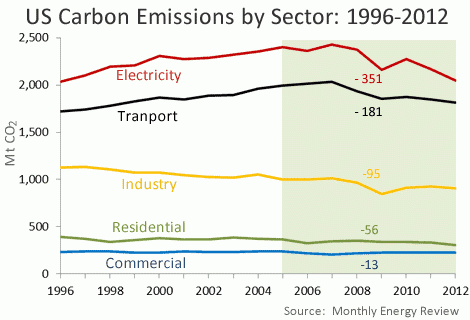
Between 2005 and 2012 the greatest drop in emissions occurred in the electricity sector. Despite the endless focus of the media on the electricity sector the declines in transport, industry and residential sectors were also significant.
By looking at each sector in turn we can get a better idea of what really happened to US carbon emissions over the last seven years.
Emissions Cuts By Sector
In an attempt to better understand the declining emissions in each sector the following charts will focus purely on the changes in emissions that occurred between 2005 and 2012.
The total changes for each of the sectors are as follows:
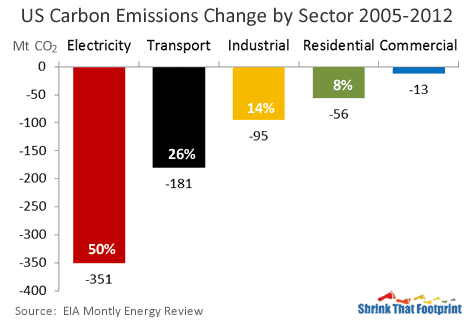
As already noted total US emissions fell by almost 700 Mt CO2 in the last seven years. Almost exactly half of this drop came from the electricity sector (50%), with transport (26%), industry (14%) and residences (8%) also playing a major role.
The decline in electricity emissions has been widely discussed elsewhere, but rarely in terms of emissions sources:

The data shows what everyone knows, a lot of coal generation has been displaced in recent years by natural gas. A smaller decline of oil based generation has also occurred against a backdrop of rising oil price. Wind has also played a key role, which can be seen in the fuel mix changes detailed within the report.
Far less well documented declines have occurred in transport emissions:
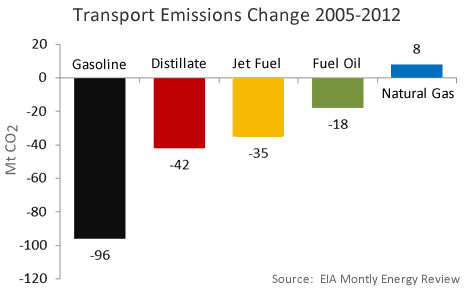
Using EIA data we can separate the transport emissions declines into different fuel types. Just over half the decline arose from falling gasoline emissions, although all oil based fuels suffered significant declines.
Separating the respective role of oil prices, the recession and efficiency in these declines is not simple. In the case of gasoline emissions biofuel production also played a role, together with reduced vehicles miles travelled and improving fuel economy.
The decline in industrial emissions also defies simplistic explanation:
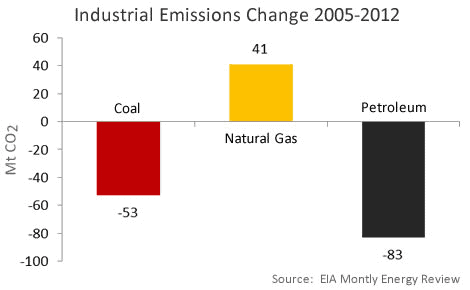
Industrial oil emissions are down considerably since 2005, coal emissions are also down while natural gas emissions are up. Unlike in the electricity sector however the decline in industrial emissions is not just about the fuel mix.
Industrial use of fossil fuels was down 8% between 2005 and 2012. Electricity use also declined by 5%. Much of this decline in energy use occurred during the height of the recession in 2008 and 2009. Since then natural gas emissions have rebounded, coal emissions remain largely flat and oil emissions have continued their decline which began in 2004.
Residential emissions are also down:
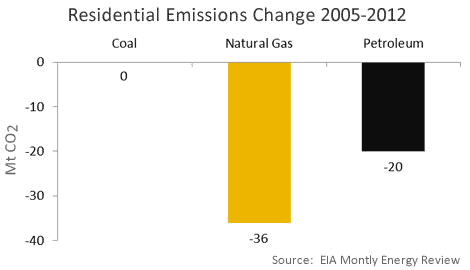
The significant decline of both natural gas and oil emissions in the residential sector has been noted by some as a sign of fast improving energy efficiency in buildings. Sadly, on closer inspection it appears the majority of this decline was due to a warm winter of 2012.
Although residential emissions were down 15% over the period heating degree days were 13% lower in 2012 than 2005, suggesting much of the decline was weather related.
As they make up just 2% of the total emissions cuts we won’t detail the commercial emissions change here, though it is largely analogous to the commercial sector.
The ‘Third Oil Crisis’
In the widespread analysis of the recent decline in US emissions both the fracking revolution and great recession have rightfully received much attention. But the complete story is more subtle, and defies simplification.
A closer look at the data shows that natural gas was actually responsible for less than half of the total emissions cut in the US since 2005. Most of these cuts have occurred in the power sector, as well as some in industry.
The importance of the recession depends on how it is analysed. Analysis against ‘business as usual’ trends ascribes more than half of the emissions decline to the great recession. This description however should not be applied to the 12% cut from 2005 levels as it reflects a larger hypothetical cut. Moreover, the US economy was considerably larger in 2012 than in 2005.
The warm winter in 2012, increased ethanol production and efficiency in vehicles, building and industry all deserve a mention, but the elephant in the room is oil prices.
In any other period in the last 50 years an oil price spike like we have witnessed since 2003 would dominate energy discussion:
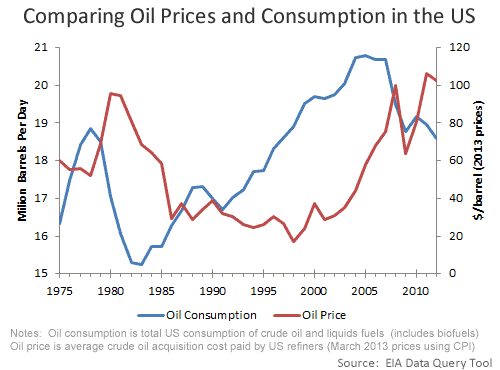
The red line depicting oil prices in this chart alone makes a good claim for the existence of a ‘third oil crisis’.
Between 1978 and 1983 US oil consumption declined by 19%, due to a combination of the ‘second oil crisis’, and the early eighties recession.
In the subsequent recessions of 1990 and 2001, oil consumption was down 4% and 1% respectively. But in both these recessions oil prices remained relatively low.
From 2005 to 2012 US oil consumption declined by more than 11%. Oil consumption plateaued in 2004, well before the recession started in late 2007. And although this recent recession was a very big one oil prices should not be overlooked.
Between 2003 and 2008 the price of oil tripled. While the recession clearly played a key role in the crash of oil consumption during 2008 and 2009, the failure of oil demand to rebound since then shows very clearly that oil prices matter.
The huge drop in oil emissions is testament to that, and a reminder that it isn’t all about fracking.
For a more detailed discussion please see the full report.
Lindsay Wilson
I founded Shrink That Footprint in November 2012, after a long period of research. For many years I have calculated, studied and worked with carbon footprints, and Shrink That Footprint is that interest come to life.
I have an Economics degree from UCL, have previously worked as an energy efficiency analyst at BNEF and continue to work as a strategy consultant at Maneas. I have consulted to numerous clients in energy and finance, as well as the World Economic Forum.
When I’m not crunching carbon footprints you’ll often find me helping my two year old son tend to the tomatoes, salad and peppers growing in our upcycled greenhouse.