Emissions Have Declined Broadly In Recent Decades
Carbon emissions decline were broad over the last two decades for a complex set of reasons. The reasons include the reduction in use of goal, the rise in use of natural gas, rise of renewables, and increasing efficiencies that reduce use of oil.
The data below from 2005 until 2012 when this article first came out shows the initial decline. Subsequently emissions continued to fall, with a noticeable blip in 2020 due to the Covid-19 pandemic. In 2021 the immediate change was to tick upward. However, long term it fits within the pattern of a drop.
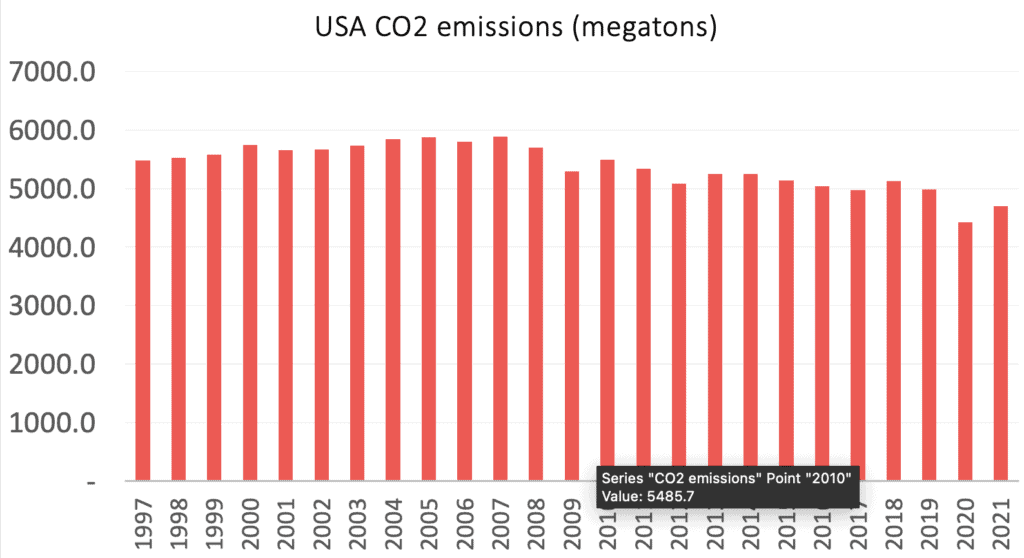
Prior To 2012 Evidence Of Carbon Emissions Decline
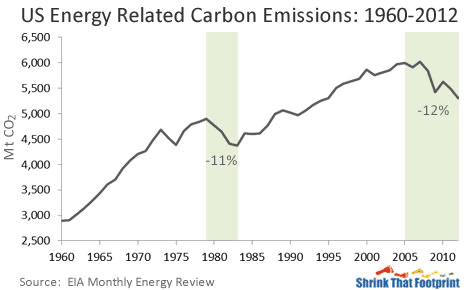
Quantitatively, energy related carbon emissions in the United States declined by 12% between 2005 and 2012. At that time, that level had not been seen since 1994. Per capita emissions fell 17% over the same period, and are now at their lowest level in 50 years. This decline in emissions occurred across the US economy. The switch from coal to natural gas in the power sector was responsible for just 35-40% of the drop.
The Historic Carbon Emissions Decline
In the seven years since 2005 energy related carbon emissions in the United States have fallen by 12%.
This decline has brought the US back to an emissions level not seen since 1994. The US become on course to achieving its target of a 17% cut on 2005 levels by 2020. Whilst the media reports the decline in emissions widely, they rare put it into historical context.
Looking back as far as 1960 we can see that the recent decline in emissions is even greater than that following the Iranian revolution.
American Footprints Lowest in 50 Years
If we look at the same carbon emissions decline in per capita terms it is even more impressive. Not since 1963 have average carbon emissions per person been so low in the United States.
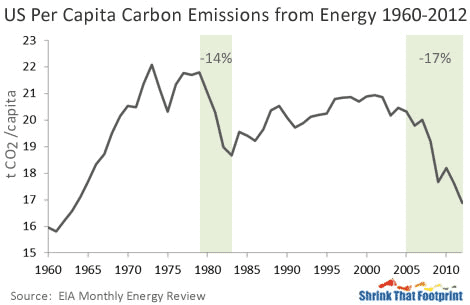
Between 2005 and 2012 American per capita energy related carbon emissions fell 3.4t to less than 17t CO2/capita. This fall of 17% was significantly greater than in the early eighties.
Energy related carbon emissions per capita are now at their lowest level in almost 50 years. At 17t CO2/capita US emissions remain very high, but nonetheless their decline is noteworthy.
Most discussion of this decline attributes it to the shift from coal to gas in the power sector. Our analysis indicates emissions fell throughout the US economy.
Coal And Oil Emissions Crash
If we separate the change in carbon emissions in recent years by fuel source we can see that while falling coal emissions are dominant, the drop in petroleum emissions is also significant.
Between 2005 and 2012 petroleum emissions in the US fell 363 Mt, coal emissions dropped by 515 Mt. Over the same time natural gas emissions grew by 183 Mt.
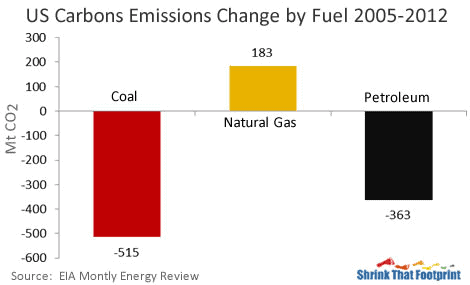
When looking at these figures it is important to remember that the change in both coal and natural gas emissions was dominated by the power sector, while the cut in petroleum emissions occurred predominantly in other parts of the economy.
Looking Beyond The Power Sector
Although separating emissions by fuel source helps to highlight the relative importance of coal, natural gas and petroleum, it doesn’t give us the full picture.
To better understand the fall in US emissions it helps to separate changes by sector. By grouping electricity generation emissions on their own, rather than by end use sector, we are able to identify where in the US economy emissions declined.
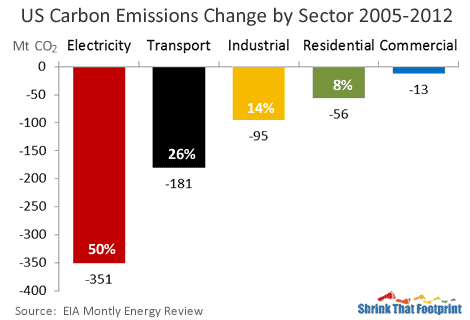
When we look at emissions changes by sector we see that electricity generation was responsible for 50% of cuts, transport 26%, industry 14%, residences 8% and the commercial sector 2%.
Declines in the electricity sector were the result of natural gas and wind displacing coal and petroleum. In the transport sector emissions fell due to a mix of reduced travel, increased ethanol supply and improving fuel economy. The industrial emissions’ decline was the result of falling energy demand from the recession. In addition improved efficiency and fuel switching to natural gas amplified the effect. In the residential and commercial sectors the mild winter of 2012 played a major role. Efficiency gains amplified those effects as well.
We include a more complete breakdown of what happened to emissions in each sector in a separate report.
Towards The 2020 Target Of Carbon Emissions Decline
Although the purpose of this report was to better understand what happened to US emissions in the last seven years, we conclude by looking forward to 2020.
Given that by 2012 the US had achieved 12% of its 17% target for 2020, there is room for optimism this goal might be reached. However this is tempered by the fact that emissions are forecast to rebound in coming years.
In the early release of its 2013 Annual Energy Outlook the Energy Information Administration (EIA) forecast that energy related carbon emissions will rise 3% from their 2012 level by 2020, due largely to growing industrial emissions
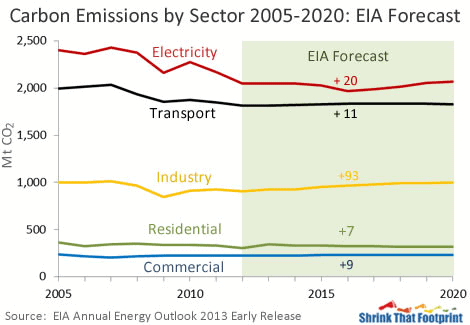
As a result there is almost a 500 Mt CO2 gap between the EIA’s forecast and the 2020 target. Although this is only a forecast, it is a clear warning that much of the momentum of recent years could easily be undone.
Given that electricity, transport and industry account for 90% of all energy related carbon emissions, their future will decide much of whether the US reaches its 2020 goal. The share of coal used in power generation, oil prices in transport and energy demand in industry will be key factors in reaching or missing the 2020 target.