
Introduction – Carbon Footprint Of A House
The carbon footprint of a house is typically one of the largest sections of your footprint. It is often dominated by emissions from heating and electricity use, although those arising from water supply and waste disposal can also make up a significant share.
This section will discuss what a housing footprint is and how we can reduce emissions from heating, cooling, electricity use, electricity supply, water and waste.
Carbon Footprint Of A House Comprises 4 Major Energy Sources
As we explained in the last step you can get an understanding of your housing footprint by calculating the emissions associated with your fuel use, electricity use, water use and waste disposal. Because our calculations focus on individual footprints, each of these calculations is based on your personal share of total household use.
Data was obtained from EPA.gov:
https://www.epa.gov/energy/greenhouse-gases-equivalencies-calculator-calculations-and-references
The easiest way to get familiar with the idea of the carbon footprint of a house is to have a look one calculated using this method. For each of our five personal categories we will use the average US citizen as an example. This housing example is calculated based on data from the Energy Information Administration (EIA) and Environmental Protection Agency (EPA) for the typical electricity, fuel and water use of US citizens as well as their waste production.
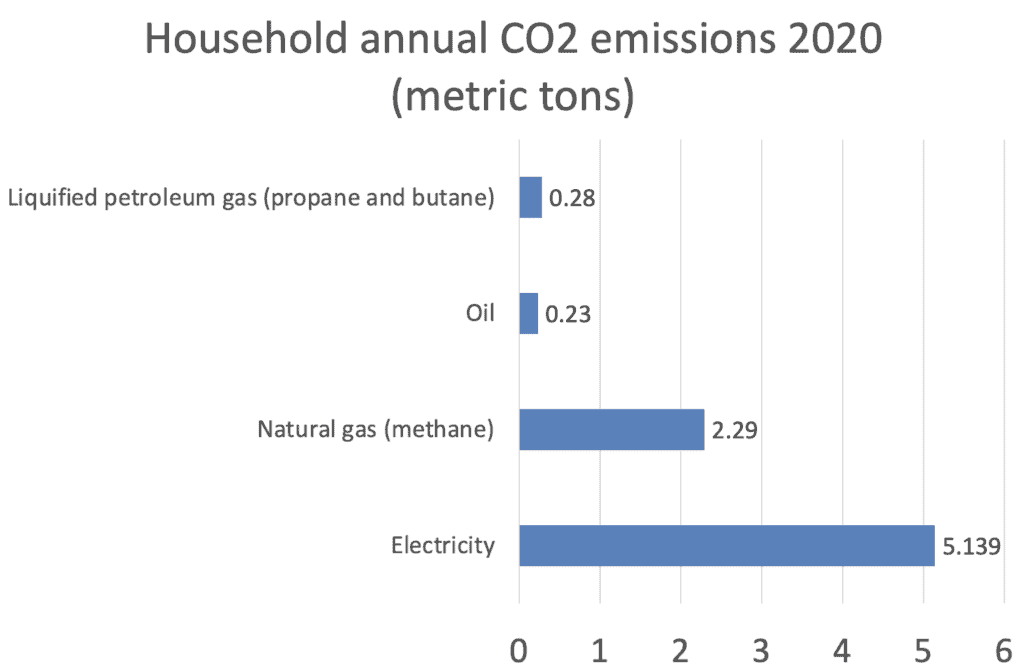
Breakdown Is Dominated By Electricity
Our estimate for the average American’s carbon footprint of a house is 7.9 tons of CO2 emitted (CO2e) per household, based on 2020 data. Around 5 tons or roughly 75% of this results from the use of electricity. The next major source is natural gas at about 2 tons CO2e per household. Gas sources account for around 300 kg each.
Variations Come From Regional Sources Of Energy
These figures are an average in which total national use has been divided up between all US residents. In reality each persons footprint may be very different depending on where they live, how many people they live with, their energy needs and their access to different fuels. In fact while almost everyone in the US uses electricity, only 60% of homes have natural gas, 11% use LPG and only 7% use fuel oil. So those who do use these fuels will use much more than shown in this average.
In Europe there is wide variation as different countries have taken different paths to decarbonization. The Scandinavian countries have access to great hydro and nuclear for example whereas the UK draws substantial energy from natural gas and oil therefore have a greater carbon footprint per person.
Global Carbon Footprints Of A House Will Differ
Internationally, housing footprints are even more diverse than in the US. Energy use in the home depends on the size of the home, its number of occupants and the nature of the local climate. Both very hot and very cold climates often result in large energy use for heating and cooling respectively. Furthermore, the carbon intensity of local electricity varies enormously from country to country, which greatly affects the footprint.
Look At Your Home Energy Bill To Break Down Your Own Carbon Contributions
When you calculate your own carbon footprint of a house you will get a footprint broken down between the various sources of emissions, like the one above. If possible it is also useful to work out your footprint in terms of end uses. This can be difficult in some cases, but between main meters and hand held gadgets you should be able to audit your own energy use and split it up between end uses like heating, hot water, lighting and appliances.
Using older data from the US we can split up our example in to their uses. It looks like this:
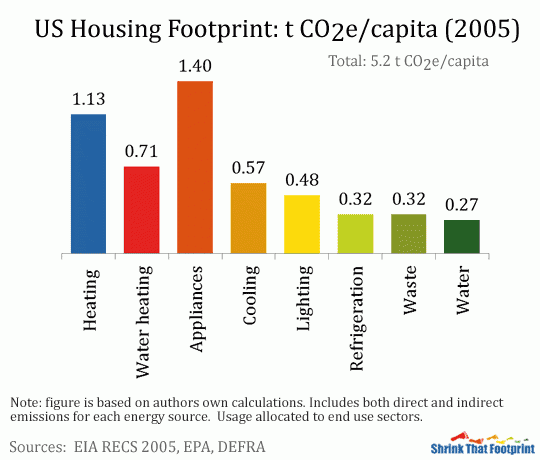
This new breakdown is even more informative. Most emissions come from appliances (1.4t), heating (1.1t) and water heating (0.7t) although cooling, lighting and refrigeration remain significant, as do waste and water emissions, which are the same as in the last example. Again this is averaged across all households, so it will vary a lot particularly with the location, size of the house and number of inhabitants.
If we look at these figures in terms of shares it looks like this:
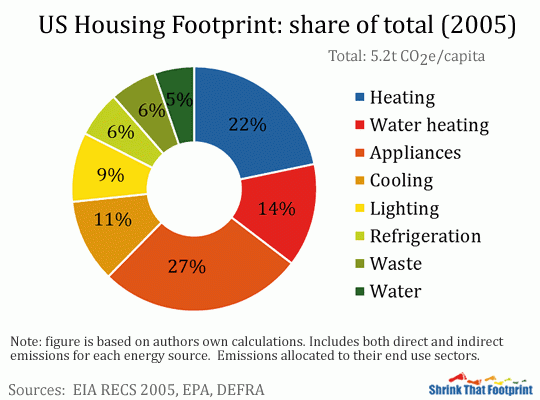
By splitting a footprint into uses it becomes apparent where the best opportunities are to reduce emissions. In this example appliances, heating, water heating and cooling make up almost 75% of the total emissions, so any carbon reduction strategy should focus on these first.
Heating And Cooling Are Big Contributors To Households All Over The World
While the average US citizen’s housing footprint is much larger than in most countries, the use sectors are quite common to all home footprints. Heating and cooling our homes is a major source of emissions, particularly in those countries with very cold or very warm climates. For example in Northern Europe heating typically accounts for more than half of a person’s housing footprint. Electricity used for appliances, refrigeration and lighting is also a major share in most countries. Waste and water emissions tend to take a smaller share but can vary a lot depending on local supply and disposal methods.
If you can work out your home footprint in terms of both sources and uses, it will be very clear to you how to reduce your emissions. Having seen the way footprints are composed this step will now move on how we can shrink them.
Heating And Cooling: How To Reduce The Carbon Footprint Of A House
Keeping our homes warm in winter and cold in summer can cause a large proportion of our housing footprint, particularly in extreme climates. These emissions can be reduced in a number of ways, the three most important of which are: controls, insulation and systems. In fact we cover in detail elsewhere on our site ways to reduce costs and carbon emissions from cooling, and heating.
Better Control Of Heating And Cooling Will Reduce Housing Footprint
Carefully controlling your heating or cooling system is the easiest and cheapest way to reduce footprint. Before spending any money on insulation or a new system it makes sense to ask yourself how you need to heat and cool your home and whether you are using the comfort you are paying for.
In many homes a great deal of heating or cooling goes unused when people are asleep or away from the house. If you have a programmable thermostat then you can set it to ensure that you don’t waste energy when you don’t need it. With even more advanced controls you can set different temperatures for different rooms or heating zones. If you spend most of your time in the living room then you’ll want it warmer than rooms like the bedroom or kitchen.
Once you have limited energy used when you are not home or in empty rooms, it is also worth considering how warm or cold you need your home to be. With most systems your heater or cooler will continue to work until the temperature at your thermostat reaches the one you have programmed. Reducing this setting by 1°C (1.8°F) can typically reduce your heating use by around 10%.
If you try reducing your thermostat setting 1°C (1.8°F) at a time you may be surprised how easily you can adjust from a higher temperature to a lower one without any great discomfort. Such a reduction can result in very large energy savings, particularly if you are also able to segment you home into warmer and cooler zones. For cooling the reverse is true, turning up the thermostat setting and increasing air circulation can limit cooling needs.
Better Insulation Will Reduce Housing Footprint
Insulation and draught proofing can substantially reduce the amount you need to heat or cool your home, greatly improving the value and comfort you will get from any heating or cooling. For heating in particular improved insulation and draught proofing can reduce the heat needed to reach the same level of comfort.
Insulating effectively requires you to think about the whole ‘building envelope’, that is the walls, roof, floors and windows that make up the outer box of your house. The materials and air tightness of this envelope, together with the difference between internal and external temperatures, determines your housing heating and cooling needs.
For a typical home heat loss might look something like this:
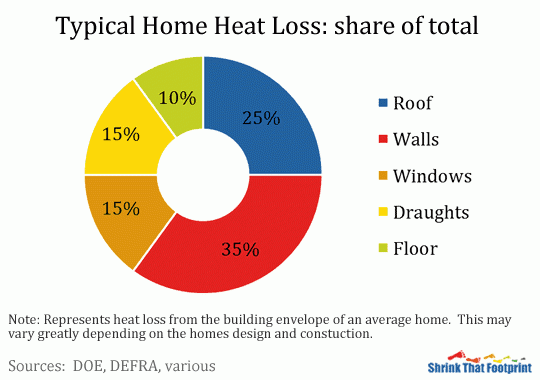
Naturally these figures will vary greatly depending on the nature of the building in question, as heat seeks the easiest path of exit or entry. It makes sense to look at each section of this envelope in turn.
You can use internal, external or cavity insulation for walls, loft insulation in the roof, double or even triple glazing for windows, excluders or caulking for draughts, and underfloor insulation or coverings for the floor. If you want to get really serious about insulation you will need to research the U-values of the materials that make up your building envelope, as well as its air-tightness. You will also want to minimize thermal bridging in areas where different materials a joined.
The goal of a serious insulation and draught proofing approach is to reduce the annual heating or cooling needed. Heating or cooling loads are usually measured per area of floor space per annum (kWh/m2a). Perhaps the best known example of this is the impressive Passivhaus standard, which for Europe aims to limit heating and cooling demand to 15 kWh/m2a. In comparison a typical UK home uses around 200 kWh/m2a, while an average new build might use 100 kWh/m2a.
Although most existing buildings don’t have the potential to reach passive house standards without a complete refurbishment, improving insulation and air-tightness can reap enormous gains in terms of emissions and comfort. Furthermore, investments in cheaper technologies like cavity wall insulation, loft insulation and draught proofing generally pay themselves back relatively quickly.
Switching To A More Efficient System Will Reduce Housing Footprint
Changing systems can reduce your heating or cooling footprint, but will often come at a large cost and is obviously only possible for home owners. By changing your system you may be able to produce the heat or cooling you need less carbon intensively. This can be a combination of using more efficient technologies and alternative fuels.
Take the example of heat. A thermal kilowatt-hour of heat can be produced in a vastly different number of ways resulting in very different footprints. The following graph shows these differences:
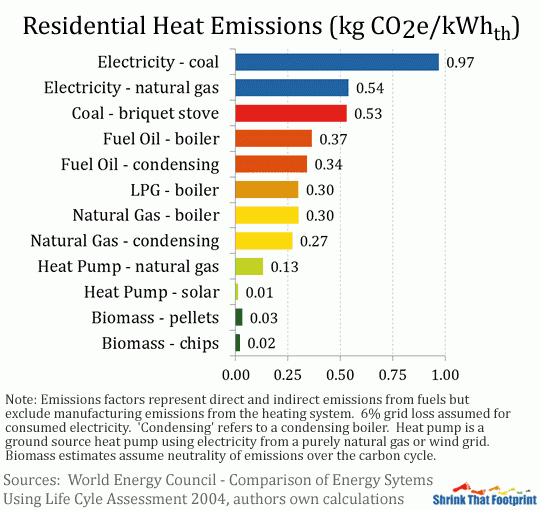
Although electricity is efficiently converted to heat the carbon intensity of this heat is determined by how that electricity has been produced and transmitted. Although the graph above shows examples of electricity from coal and natural gas, if the same electricity was instead produced by hydro, nuclear or wind it would be less than 0.03 kg CO2e/kWhth.
Coal is a very carbon intensive fuel source, while fuel oil, LPG and natural gas are slightly less so . Newer condensing boilers can improve efficiency by around 10-20% by recycling exhaust heat into usable heat, thus improving the overall carbon intensity of heat supplied.
Use Of A Heat Pump Will Increase Efficiency
Heat pumps are a low-carbon source of heat. A heat pump works like a reverse cycle fridge by drawing heat from the earth or air. A good ground source heat pump can deliver as much as 4 kWh of heat for each kWh of electricity used, while for air source heat pumps this is more like 2-3 kWh. If the electricity used for a heat pump is also quite low-carbon then a heat pump can provide heat with extremely low carbon intensity.
Use Biomass Fuels To Be Carbon Neutral But Causes Pollution Problems
Biomass boilers using chips, pellets and wood have such small footprints because the carbon dioxide emitted in combustion are assumed to be carbon neutral. This is because the resulting emissions are equal to those that have been sequestered during the plant’s growth in recent years, in contrast to fossils fuels. Although carbon neutrality is commonly assumed it requires that the source of the biomass is regrown and can potentially imply a delay of decades between the emitting and sequestration of the emissions in question.
Biomass burning also creates local air pollution which can affect health. It is also a source of aerosols and black carbon which cool and warm the climate respectively. Clean burning pellet systems supplied with industrial wood waste pellets address each of these concerns most effectively. They can be a very effective source of low-carbon heat in the right context.
Switching to a new system is invariably expensive but can have a huge impact on your footprint, particularly if you use a lot of heat. Such changes often make the most financial sense if your heating system is old, inefficient or uses an expensive fuel like oil. When it comes to cooling most air conditioning systems use electricity. In this case the majority of emission reductions can be made by improving the efficiency of the system, like using a heat pump, or getting lower carbon electricity supply.
Reducing Electricity Use Will Reduce Housing Footprint
To reduce your emissions from electricity you need to use less electricity or lower carbon electricity. The former will generally save you money, whilst the latter will probably cost you money. So it is makes sense to reduce your electricity use first before looking at cleaner electricity supply or generating your own.
Measure, Measure, Measure: Monitor Your Electricity Use With A Plug-Monitor
Using your mains meter, plug-monitors or more sophisticated systems you can work out your major uses of electricity. If you work out the wattage and typical usage of each electrical good in your home you can build up a picture of where your kilowatt-hours go. By matching this against your main meter you can ensure it is a decent estimate. Such an audit can be surprising and is bound to improve your conservation of electricity. Having a monitor that displays your live usage is a very good way to increase your awareness of electricity use.
For most of us electricity use will be dominated by things like lighting, refrigeration and appliances around the home. Obviously if you have electric heating, cooling or water heating, this will be a dominant part of your use.
The following graph is the typical American household breakdown:
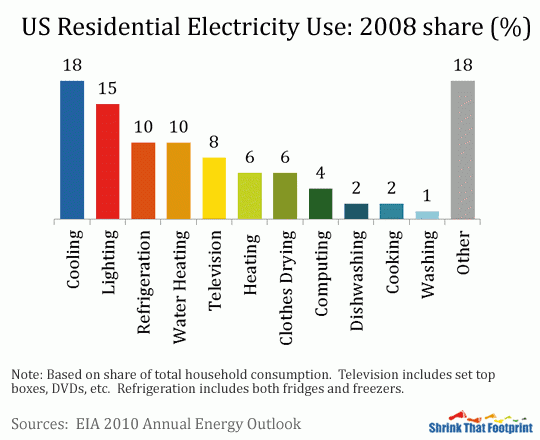
American residential electricity use is very large per person relative to most countries, but the breakdown is similar in many ways. Your own electricity use on the other hand could look very different to this and you really won’t know until you make a few measurements. Once you have a picture of your usage you can begin to reduce it by going through each of your major uses.
Switch To More Efficient Lighting
Reducing your lighting electricity use is a case of turning off your lights or getting more efficient ones. Simple habits of always turning off lights in empty rooms will help, but most of the big gains can be made by changing your bulbs. Switching from old incandescent bulbs to compact fluorescent (CFL) will produce similar light with around 20% of the electricity, while new light emitting diodes (LED) perform even better. Both the cost and quality of new lighting technologies has improved so rapidly that new bulbs often pay themselves back quickly, particularly in areas where they are used a lot.
Switch To More Efficient Refrigeration
Because your fridge and freezer are on all day every day throughout the year they are often a major user of electricity. You can reduce the electricity your fridge and freezer use by not setting them too cold, insuring they have proper seals, are well defrosted and located in the coolest area possible. Much more important however will be the choice you make if you replace your fridge and freezer.
In most countries there are efficiency standards, like the A-G energy labeling in Europe or the Energy Star in the US, which you can use to inform your choices. While these tell you how efficient the fridge or freezer is for its class they are only so helpful, because they don’t account for size. By getting the highest class possible and keeping your fridge as small as possible given your needs, you should be to able find a system using as few kilowatt-hours per year as possible.
Control Your Entertainment System Power Draw
In the last twenty years electricity use for televisions, set-top boxes, computers, phones and other gadgets has grown dramatically. Not only do they consume lots of electricity during use but their standby usage can be significant as well. By simply turning things off when they are not used or getting useful standby controls (or killers) you can often reduce your electricity use by as much as 5%.
When buying new products it also helps to focus on the wattage rather than ratings alone. For TVs the type and size of the screen will make a large difference, with electrical usage being anything from 50W to 1000W when on. Similar variations occur for computers, with laptops and tablets generally drawing far less power.
Fill Up Washers And Dryers And Get More Efficient Equipment
Cleaning can be a very surprising source of energy demand. Although cleaning appliances are not on constantly, they often have very high wattage. Clothes dryers in particular use a lot of electricity, so using drying racks or a clothes line instead can provide easy savings. Reducing the energy use of your washing machine is difficult. You can however make some reductions by making sure the machine is filled for each cycle and that the coldest temperature possible is selected.
Appliances Are A Way To Control Energy Use
Although these are only a few examples the general principles of turning things off when not in use, using appliances efficiently and buying energy-efficient products can be applied to most things. Such steps can significantly reduce your electricity use and are often cost effective.
Having lowered your electricity use as much as possible the other way to reduce your electricity footprint is to access low-carbon supply of electricity.
Electricity Supply
The lower the carbon intensity of your electricity is the lower your emissions are for each kilowatt-hour you use. Getting low-carbon electricity can be an expensive process, so it is worth researching well before making any decisions. The basic options are either to pay for low-carbon supply or to generate your own. Before looking at these options it is important to understand the carbon intensity of electricity generation, and how grid electricity varies from place to place.
Electricity generation
Around the world electricity is mostly generated from four main sources. Coal provides around 40% of total power, natural gas roughly 20%, while nuclear and hydro both supply about 15% of global electricity. The remaining 10% is a mix of oil, biomass and other renewables like wind and solar.
The carbon intensity of electricity varies greatly depending on the technology used. This can seen by comparing the emissions that result from the generation of a kWh of electricity for different sources. For each source the total intensity includes both the direct emissions from combustion and the indirect emissions from plant manufacturing as well as fuel production and supply.
The following graph shows these differences:
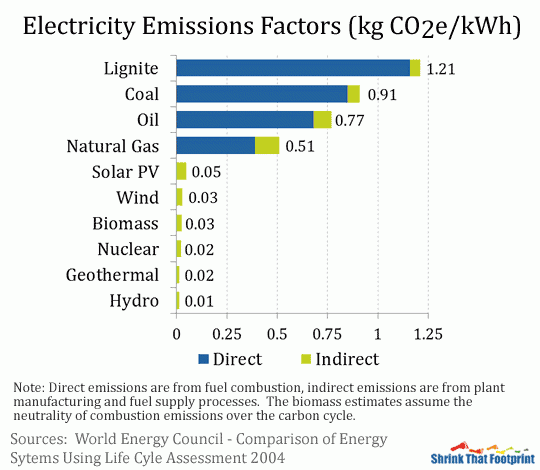
Lignite (brown coal) is the most carbon intensive form of power production at 1.2 kg CO2e/kWh followed by coal at around 0.9 kg CO2e/kWh. In fact the values for all types of coal vary depending on the coal’s quality and the generation technology used. Oil based generation is also carbon intensive at around 0.8 kg CO2e/kWh, while natural gas is the lowest carbon of the major fossil fuels at 0.5 kg CO2e/kWh.
In contrast solar, wind, nuclear, geothermal and hydro are all less than 0.05 kg CO2e/kWh as they only have limited indirect emissions, mostly caused by manufacturing the generation technology. As explained earlier the direct emissions from biomass are generally not counted in these figures as they are considered neutral over the carbon cycle.
The mix between these technologies, and the losses from transmissions and distribution, determine how carbon intensive grid electricity is in different places.
Grid electricity
The proportions of different generation technologies used, often called the ‘fuel mix’, varies enormously between countries. In fact in many large countries it varies between different grid regions. This means that the carbon intensity of electricity is very different from place to place.
The following graph shows the average carbon intensity of electricity consumed in different countries:
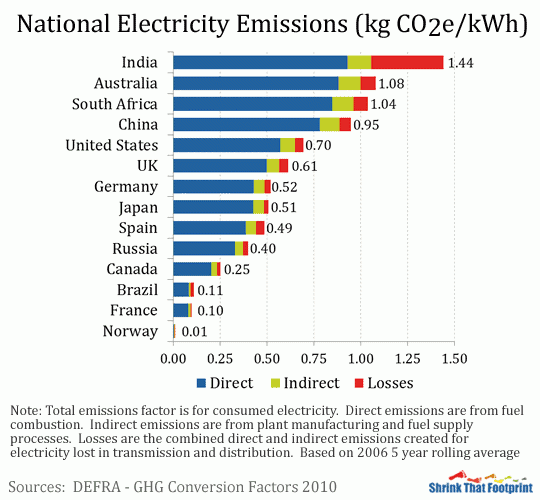
The total carbon intensity is for consumed electricity. This means it takes account of the direct emissions from combustion, indirect emissions from plant manufacturing and fuel supply as well as losses from transmission and distribution. Just a quick glance at this graph shows the stark differences between countries. These differences are due largely to the changes in the fuel mix, while losses are generally around 6% of the total on most modern grids.
India, Australia, South Africa and China use mostly coal in their power generation, which explains the high carbon intensity of their electricity. In the US coal makes up about half of the fuel mix, though that is falling due to cheap shale gas supplies. The UK, Germany, Japan, Spain and Russia have quite broad fuel mixes that include natural gas, nuclear, coal, hydro and renewables. Canada and Brazil have large hydro capacity which explains their low carbon intensity while France is around 80% nuclear. Norway has literally 99% hydro production, explaining the remarkably low carbon intensity of its electricity.
If you use grid electricity the local emissions factor will have a very large effect on your home footprint. For example if your share of household electricity was 1,000 kWh per year and you lived in Australia, South Africa or China this would result in a footprint of around 1 t CO2e. Living in Japan or Spain this would be 0.5 t CO2e, while in Brazil or France it would be just 0.1 t CO2e.
If you live in an area where grid electricity has a high carbon intensity then switching to low-carbon supply or generating your own electricity could produce large reductions in your footprint.
Switching To Low Carbon Energy
In many countries consumers can now opt to have a low-carbon or ‘green’ electricity tariff. Understanding how effective these tariffs are at reducing emissions can often be quite difficult, so it is important to do your own research.
Two criteria that are useful when judging a green tariff are the fuel mix of the supplier and how much investment the company makes in new capacity. While many tariffs claim to be ‘green’ the actual fuel mix may be very brown, so you should investigate how much of the utility’s electricity actually comes from renewables. The higher their share of renewables the lower the emissions factor of their electricity will be.
The second criteria, whether they are investing in new renewable capacity, can be more difficult to verify. Ideally you want the extra expense of your green tariff to be aiding investment in new renewable capacity. Capacity that your utility isn’t obliged to build by local law. This investment will lower the carbon intensity of your own supply and the grid in general in the longer term.
If you can find a company that has a largely renewable fuel mix, and is investing in new renewable capacity, then they may have a tariff well worth considering.
Home Generation To Reduce Carbon
Generating your own electricity can be an expensive business, but it is one of the best ways to ensure you have low carbon electricity.
In many countries subsidies and feed in tariffs make the installing of home generation more attractive for the consumer. Basically this means you can sell electricity back to the power company. On top of this home generation can insulate you from potential rises in future electricity prices, add value to your home and helps focus your mind to the challenge of conserving electricity.
Despite growing interest in home generation technology choice is limited. Solar photovoltaic (PV) and micro wind are the most common options, with the more exotic being mini-hydro where possible. While micro wind may be more cost-effective in the right location, there needs to be enough wind, space and local permission for a turbine. As a result of these challenges solar PV is often the only viable option for many homes, because all you need is some roof space facing the sun’s rotation.
Over the years that a solar PV system produces electricity it will do so at a carbon intensity of around 0.05 kg CO2e/kWh, or perhaps even lower depending where it was made and where it is placed. In countries with broad fuel mixes, like Germany, Japan and the UK, this will save roughly 0.5t of CO2e for each 1,000 kWh produced. In countries that use a lot of coal like Australia, South Africa and China it will save around 1t CO2e for each 1,000 kWh produced.
Because solar power is so intermittent, most residential solar is tied to the grid. When the system is producing more power than needed by the home, the power is exported to the grid. As a result, houses with solar may use as little as 20-50% of the power they generate. The remainder is exported to the grid, which is often viewed as an offset for electricity imported at other times.
Water Heating Is A Major Contributor
Water heating is a significant source of emissions in most countries. Water supply can also be important if the water you use is treated or needs to be pumped a lot to reach its destination.
The average person in a wealthy country uses 40-110 litres (11-29 US gallons) of hot water per day, predominantly for showers or baths, but also for some washing and cleaning. Water heating emissions can be reduced by using less hot water or heating it less carbon intensively. Using less hot water is generally a case of fewer baths, shorter showers, installing low flow shower heads and generally not wasting hot water.
Heating less carbon intensively can be done by turning down the heat of the water or changing systems. Many thermostats are set for 60-80°C (140-176°F) despite not needing water much hotter than(50°C) 122°F. In terms of carbon intensity natural gas is preferable to heating oil, while electricity depends on the fuel mix.
In terms of renewable hot water the obvious choice is solar thermal, which uses the sun’s rays to heat water directly. This can supply as much as 50-80% of your yearly hot water needs depending on your demands and where you live, and often results in reasonable payback periods. If combined with space heating, water heating can also be achieved with a biomass system or a heat pump where practical.
Although generally less important than water heating the emissions from the supply of fresh water can also be significant. The treatment of water, pumping it to its destination and maintenance of the supply infrastructure can be surprisingly large sources of emissions. The only way to really affect your water supply emissions is to minimise mains water use. This can be done through water conservation, recycling grey water and catching rainwater for things like garden use.
Waste Is A Major Contributor
Globally, waste emissions typically account for about 3% of a person’s footprint. These emissions depend mostly on the volume of waste produced and the way it is treated. You can reduce your waste emissions by minimising the amount of waste you produce and changing what you do with that waste.
Waste can minimised by being careful about what you purchase, limiting packaging and re-using things where possible. When you do choose to get rid of something it is generally sent to landfill, incinerated or recycled. As a general rule landfill causes the most emissions, incineration fewer emissions and recycling far fewer, although this does vary material to material.
The most important contribution of recycling is in providing materials for new production whilst avoiding the use of virgin resources. Although the carbon gains from recycling food and garden waste are quite limited, recycling glass, paper, metals and textiles can reduce emissions significantly. This topic will be taken up in more detail in Step 8 when we discuss product footprints.
Summary
In this step we have focused on the major sources of emissions from our housing and how we can reduce them.
We have looked at reducing heating and cooling emissions by using controls, insulation or different heating systems. We have considered ways of reducing electricity use and seen the potential of low carbon supply and home generation. We also looked briefly at reducing water and wasted emissions.
Back To the 30 Day Shrink Guide: Introducing the Shrink
Lindsay Wilson
I founded Shrink That Footprint in November 2012, after a long period of research. For many years I have calculated, studied and worked with carbon footprints, and Shrink That Footprint is that interest come to life.
I have an Economics degree from UCL, have previously worked as an energy efficiency analyst at BNEF and continue to work as a strategy consultant at Maneas. I have consulted to numerous clients in energy and finance, as well as the World Economic Forum.
When I’m not crunching carbon footprints you’ll often find me helping my two year old son tend to the tomatoes, salad and peppers growing in our upcycled greenhouse.