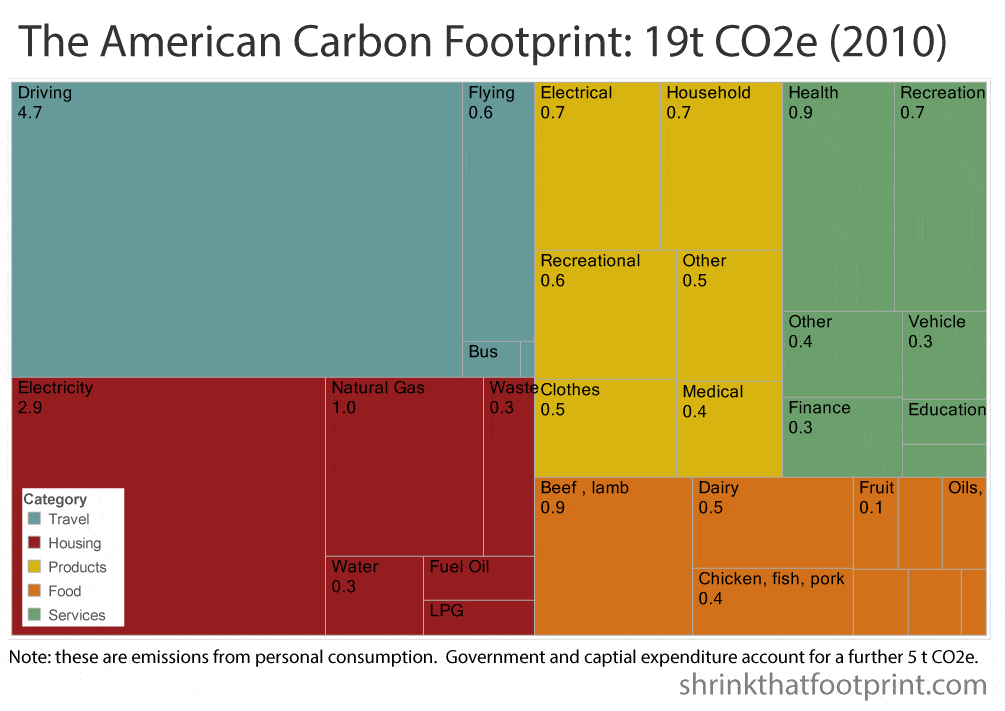
Americans emit 19 tons of CO2 per year
In the process of researching and writing our free eBook ‘Emit This’ I mapped out the average American’s carbon footprint. The result was the tree map above which shows the typical spending of an American results in 19 t CO2e of greenhouse gas emissions, split into 5 categories. A further 5 t CO2e results from construction and government spending.
For someone who isn’t trained in environmentally extended input-output analysis this is a decent calculation, but sometimes you’ve just got to hand it over to the professionals.
A new paper by carbon wonks extraordinaire Christopher Jones and Daniel M. Kammen has mapped the average Household Carbon Footprint (HCF) for every zip code in the contingent US. Yep, every zip code!
Suburbia Buries Urbanization Benefits

Time and again studies have shown that urbanization can deliver large carbon reductions by reducing per capita energy use in transport, housing and construction. But in this new study Jones and Kammen show that benefits of city living in big cities like New York, Chicago and San Francisco are cancelled out by higher emissions in their own suburbs.
In fact the study shows that household carbon footprint actually increases with population density until you reach 3,000 person per square mile. This result is a stark contrast to many previous studies showing consistently negative correlation between density and emissions.
For those of us whose attention span won’t extend to the full academic paper you can use the interactive maps below to focus on a city of choice. The first map shows the average HCF for each zipcode, and the next two help explain the most important drivers of variation, which are household energy use and transport demand.
You can zoom all the way in to any zip code and click on it to see how it stacks up.
Average Annual Household Carbon Footprint
This map displays average annual household carbon footprints for zip code tabulation areas* in the contiguous United States.
Household Energy Carbon Footprint
This map displays average annual household energy carbon footprints for zip code tabulation areas. Carbon intensity of electricity and heating fuel choice are big drivers of variation.
Transportation Carbon Footprint
This map displays average vehicle miles traveled by households residing in zip code tabulation areas.
The average carbon footprint of American households is astronomical by any standard, at 48 t CO2e. But in some suburban areas of greater Chicago, New York and San Francisco it is pushing towards 100 tonnes.
According to the authors the complex variation of these suburban emissions suggests:
that an entirely new approach of highly tailored, community scale carbon management is urgently required
Check out more in the links below:
Maps: Average Annual Household Carbon Footprint (2013)
Calculator: Cool Climate calculator
Lindsay Wilson
I founded Shrink That Footprint in November 2012, after a long period of research. For many years I have calculated, studied and worked with carbon footprints, and Shrink That Footprint is that interest come to life.
I have an Economics degree from UCL, have previously worked as an energy efficiency analyst at BNEF and continue to work as a strategy consultant at Maneas. I have consulted to numerous clients in energy and finance, as well as the World Economic Forum.
When I’m not crunching carbon footprints you’ll often find me helping my two year old son tend to the tomatoes, salad and peppers growing in our upcycled greenhouse.
