Introduction
“Electric vehicles are worse for carbon emissions than gasoline vehicles” – this old claim continues to float around. We did a careful analysis using 2022 numbers and find that under almost no circumstances would this be true. TLDR: electric vehicle emits 2-5 times less carbon dioxide per mile or kilometer traveled for three scenarios: clean grid countries like France, mixed grid countries like US, and dirtier grid countries like China. But read on if you want to understand the way to get to this conclusion yourself, both objective readers and skeptics alike.
Background
In 2013 Bjorn Lomborg was invited to write an opinion piece on electric vehicles in the Wall Street Journal. Lomborg is an author and researcher who heads a somewhat murky “think tank” called the Copenhagen Consensus Center. Lomborg argues against reacting to climate change and criticizes renewable energy, electrification efforts as being wrong-headed, unreasonable, detrimental to developing nations, and even dishonest.
In his arguments, he doesn’t detract from climate change and its anthropogenic origins, but rather that our actions to reduce it are incorrect. In the WSJ article, he claimed that electric vehicles were so bad that after accounting for production costs, time to charge, effective lifespan of electric cars, they’re worse than gasoline cars. At that time, the electric vehicle industry was much smaller than it is now and data was harder to come by. In fact this site ShrinkThatFootprint had covered Lomborg’s arguments as well and found them specious.
It’s worth revisiting now, in 2022, what Lomborg wrote before, compared to now with almost 9 years of technology improvements, policy changes, and evolution of the commercial landscape of electric vehicles. We find that the way the world moved has been decidedly in the positive for electric vehicles, in terms of data, technology development, and global thinking. Even the WSJ has turned and argued that electrification of cars will have a major impact on carbon reduction.
Lomborg continues to make half claims and strange calculations about electrification bringing down global temperature by 0.0009 degrees. It’s not clear if he understands the concept of quantitative uncertainty and error propagation to reach these types of ridiculous conclusions. But that’s really an entirely different article to talk about lack of numerical incompetence. In addition, Lomborg has turned his attention toward the development angle, proposing vaguer arguments that our current course is harmful to development. Anyway, on to the analysis which is useful regardless of what antics Lomborg is up to.
Simplifying assumptions
In order to carry out an analysis to test Lomborg’s claims in 2013, we had to make reasonable and also simplifying assumptions. Reasonable assumptions are backed up by references that we list both in the analysis and at the end of the article. Simplifying assumptions are used because we can’t account for all the differences between different lithium source mines, municipal electrical grids etc. It’s unclear what we gain from getting down to the decimal point for every number because we know the differences are already large by several multiplicative factors.
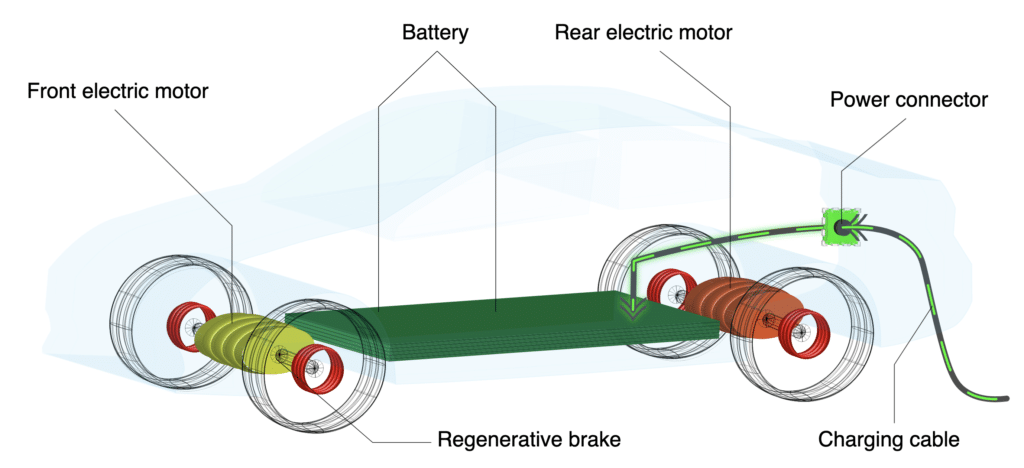
Manufacturing emissions
The carbon intensity of an electric car depends on where it’s manufactured and where the lithium is mined. The numbers become a bit easier to deal with if you focus on a specific make and model of a car, so we took the Telsa Model 3 as an archetypal electric car and used those. Even in this case, if the lithium supplier changed for example the numbers will change. We checked two sources, one is from the Journal of Industrial Ecology, and the other from a Wall Street Journal on the same topic in 2021.
Electric grid emissions
The carbon intensity of the electric grid also factors into the lifecycle emissions of the electric car. In countries with high levels of non-carbon electricity energy sources, like France which relies on nuclear for 80% of its power, the carbon intensity of a car being charged from that grid will be very low. Whereas in countries with high levels of fossil fuel burning to make electricity will correspondingly have much higher carbon intensity in charging the car. Countries like the United States sit in the middle of the pack with a mix of nuclear, hydro, wind, natural gas, oil and coal burning.
These three situations in fact are a good reflection of low vs medium vs high carbon intensity electricity sources, so we broke out the analysis for electric vehicles in these three countries. Finally, another major assumption we made that is contrary to Lomborg’s assumptions is that an electric vehicle will last 150,000 miles of use (240,000 km).
Car lifespan – 150,000 miles or 240,000 km are reasonable
The number Lomborg used, 50,000 km for the life of a Nissan Leaf, defies reasonable belief that an owner will discard their car after 50,000 km. Even with 2013 numbers the Leaf could have been been used for day-in day-out commuting thousands of miles annually and certainly not thrown away after 50,000 km. The 150,000 miles lifespan for an average car is from the NHTSA survey of vehicles in 2006. Since then it’s hard to argue that electric cars have shorter lifespans, and almost certainly would have greater lifespans.
Gasoline burning internal combustion engine (ICE) emissions
To get the emissions of a gasoline burning vehicle, we need to consider three factors. First we need the production emissions, which we account for separately. Then we need the combustion emissions per volume of gasoline, which are known from theory. Finally we need the efficiency of the car, i.e. how far it travels on a volume of gas, like miles per gallon or km per gallon. We will take the average ICE efficiency, which is 28 miles per gallon according to 2021 estimates from EERE, a government energy agency.
Results
We find that contrary to Lomborg’s casual opinion-heavy analysis, an accounting of these factors shows, even with errors attached to all numbers, that electric vehicles will outperform gasoline vehicles in terms of carbon emissions 3 to 4-fold! Over the lifespan of a car, that translates to 40-50 tons of carbon per car. If a big fraction of the hundreds of millions of cars in the world were turned into electric vehicles, that would mean billions of tons of carbon reduced from emissions.
Life cycle emissions for electric vehicle vs gasoline vehicle
| Emissions type/Car type | Electric Vehicle (France) | Electric Vehicle (USA) | Electric Vehicle (China) | Gasoline vehicle |
| I. Manufacturing | 53 g CO2 / km (145 g CO2 / mi) | 53 g CO2 / km (145 g CO2 / mi) | 53 g CO2 / km (145 g CO2 / mi) | 31 g CO2 / km (68 g CO2 / mi) |
| II. Source fuel production | 9 g CO2 / km (13.8 g CO2 / mi) | 57 g CO2 / km (91 g CO2 / mi) | 81 g CO2 / km (129 g CO2 / mi) | 24 g CO2 / km (39 g CO2 / mi) |
| III. Source fuel usage | – | – | – | 222 g CO2 / km (356 g CO2 / mi) |
| Total | 62 g CO2 / km (99.2 g CO2 / mi) | 110 g CO2 / km (236 g CO2 / mi) | 134 g CO2 / km (214 g CO2 / mi) | 288 g CO2 / km (480 g CO2 / mi) |
Complications due to car lifespan
The true picture is more complicated. Over the life cycle of the car yes an electric vehicle has lower emissions per mile. However, at the beginning of an electric vehicle’s life, an electric vehicle incurs about 70% more carbon emissions due to the energy cost of mining battery components including lithium. So the electric vehicle starts off with a bigger carbon burden. Over time, this gets damped down by the lower emissions cost of the using the car, and the sunk carbon cost diminishes in importance. Imagine the extreme scenario if an electric vehicle were driven 100 miles and then thrown away. Then its carbon cost would be much higher compared to the non-electric vehicle because of that manufacturing carbon cost.
The cross-over point of where an electric vehicle becomes more carbon efficient than a gasoline/internal combustion engine vehicle, is estimated to be 5,000-10,000 miles. We will save that analysis for another time.
Summary
So there you have it. These numbers are the basis for us saying that electric vehicle emits 2-5 times less per mile or kilometer traveled. Sure, there will be immediate carbon reduction from the switch to electric vehicles. We propose that the knock-on effects are positive too. The ancillary benefits of moving to an electrified energy economy extend beyond electric vehicles because of infrastructural and scaling improvements in raw material extraction, energy storage, delivery. But again, that’s another article. EVs continue to proliferate making a bigger share of the car market. ShrinkThatFootprint devotes a special section to EV reviews to help readers keep up with the choices.
References
Carbon intensity of all electric grids
BP carbon intensity of energy generation
2021 fuel efficiency of ICE cars
EIA estimate of carbon intensity of energy generation in US : (0.38 metric tons of CO2 per megawatthour or 380 kg CO2 per mWh, same as 380 g CO2 per kWh)
Our world in data carbon intensity of electricity from European Environment Agency : Tesla efficiency estimates: 100 km / 14.9 kWh, or 14.9 kWh / 100 km; 57 g CO2 / km
ICE usage emissions estimate: 8887 g CO2 / barrel, to convert to g CO2 / km, we need to know for given volume of oil (like 1 barrel) what is the distance traveled (ICE fuel efficiency)
Conversion to emissions per gallon instead of barrels: 8887 g CO2 / 42 gal (because 1 barrel is 42 gal)
ICE fuel efficiency: average efficiency 1 gal / 25 mi or 1 gal / 40 km
Carbon intensity of gasoline production
Calculating gasoline car emissions per kilometer:
40.7 kgCO2e per barrel
40700 g CO2 / barrel * 1 barrel / 42 gals * 1 gal / 25 mi
40700 g CO2 / barrel * 1 barrel / 42 gals * 1 gal / 40 km
J of Indust Eco manufacturing emissions of EV and non-EV cars
Manufacturing emissions of Telsa vs Toyota
EV 30,000 lbs of CO2 is equivalent to 13,600,000 million grams of CO2, over 150,000 km is 91 g CO2 per km (145 g CO2 per mi)
ICE 14,000 lbs of CO2 = 6,400,000 million grams of CO2, over 150,000 km is 42 g CO2 per km (68 g CO2 per mi)
The updated analysis shows that a typical passenger car will travel a lifetime mileage of 152,137 miles, while
NHTSA Vehicle survivability and travel mileage schedules 2006
light trucks will travel 179,954 miles. Passenger car lifetime weighted present discount factors at 3 percent, 7
percent and 10 percent are, respectively, 0.8304, 0.6700 and 0.5824; for light trucks with the same discount
rates, respectively, 0.8022, 0.6303 and 0.5419.
Tesla’s impact report https://www.tesla.com/ns_videos/2020-tesla-impact-report.pdf

Anne Lauer
Anna Lauer is a writer, gardener, and homesteader living in rural Wisconsin. She has written for Mother Earth News, Grit, and Hobby Farms magazines. Anna is writing a new book about growing your food for free and an ultimate guide to producing food at little to no cost. When she’s not writing or gardening, Anna enjoys spending time with her husband and two young daughters.