In the decade before 2010 average natural gas prices had doubled. Since 2010 until now, they remained flat until very recently. Our data goes to 2021. Events in 2022 have impacted gas prices even more. It will a little time to see the gas price statistics. Suffice it to say that shortages in Europe are rippling across the world. The US is the most insulated spot. Local gas production has remained stable. More LNG is being piped to Europe from the US.
A decade ago, the leader of the UK Labour opposition, Ed Miliband, scored huge political points by proposing a largely unworkable price freeze. John Major, then the conservative ex-prime minister, blind sided his party by calling for a one off windfall tax to bolster winter fuel payments. And the Big 6 energy firms are now less popular than the big banks, which really is unpopular.
For poorer families the price hikes are grim news. But just how expensive is UK natural gas compared to other countries?
Average Natural Gas Prices in 7 Countries
In the chart below we compare the average price of natural gas for households in the Canada, US, Germany, UK, Netherlands, and Japan/Korea over the last decade. The units are US cents per MMBTU. Japan and Korea are put together because of the Japan-Korean Marker, which is a price index for the region.
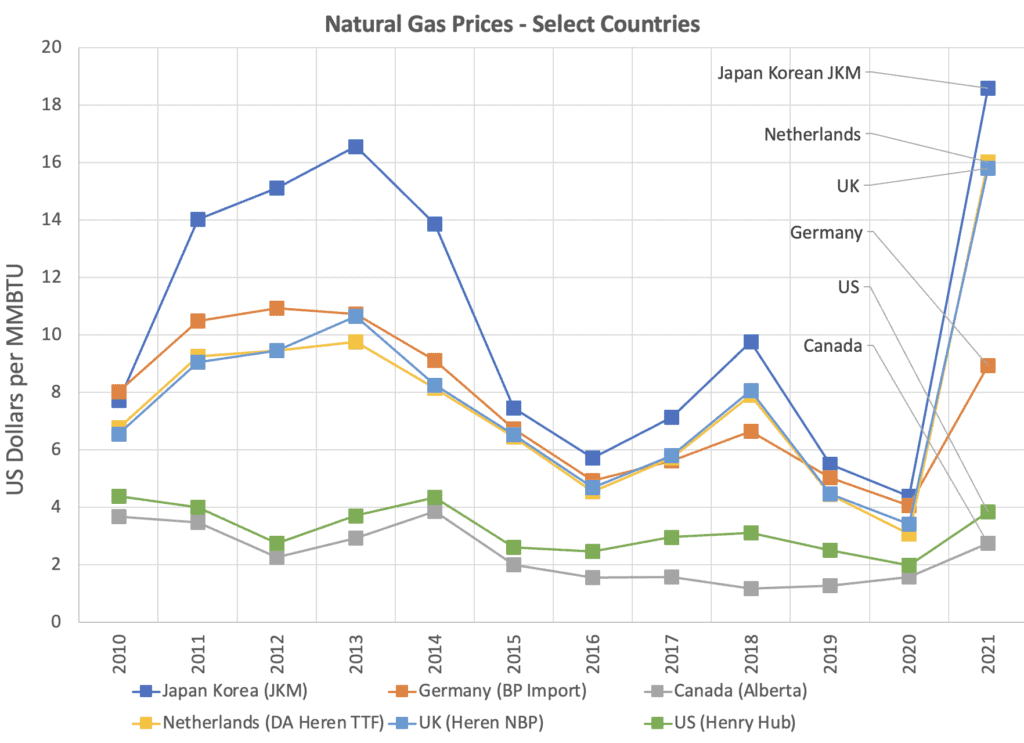
One caveat is that import prices, industrial prices and residential prices are different due to market factors. So you might wonder why the number on your bill is different from the number here. We also take a slice of the natural gas price figure from 2021 and put them into a table below. You can use this table for your own investigation. The cost is stated in terms of dollars per million British thermal units (MMBTU). The table is sorted from highest gas cost (Japan Korea Marker) to lowest (Canada, Alberta).
| Country | Natural gas cost in 2021 (per MMBTU) |
| Japan Korea (JKM) | $18.60 |
| Netherlands (DA Heren TTF) | $16.02 |
| UK (Heren NBP) | $15.80 |
| Germany (BP Import) | $8.94 |
| US (Henry Hub) | $3.84 |
| Canada (Alberta) | $2.75 |
Japan consistently experiences high costs
Take one look at the price of natural gas in Japan, and you’ll quickly realize why they lead the world in developing heat pumps and fuel cells. Japan is one of the top two LNG importers. LNG is a way of transporting natural gas. LNG stands for liquefied natural gas. It’s a product of compressing and cooling the gas to liquid form which is then put into containers and transported across the ocean. Whereas Europe is blessed (or cursed) with land-based pipes that carry natural gas, Japan’s separation from the continent means LNG is needed until another solution is developed.
UK prices have risen despite access to North Sea fields
You can see clearly in the blue line how UK natural gas prices were flat over the last decade until very recently. Not shown in the chart is that local prices have risen over last twenty years. In fact, they have doubled in real terms since 2005.
As late as 2003 the UK was still a net exporter of natural gas. The UK is blessed with abundant fossil fuels in the North Sea field. The North Sea field sits between the UK and the Scandinavian countries. Just 10 years later in 2013 the UK ended up importing more than 50% of natural gas. Over 20% is piped from Norway, 10% piped from the Netherlands and a further 20% arrives as liquefied natural gas (LNG) from Qatar. The growing exposure to tightening LNG markets in recent years has been a key driver of rising natural gas prices.
To make a more considered comparison between prices in these 5 countries it is useful to convert prices using purchasing power parities (PPP).
Gas Prices Compared Using Purchasing Power
By using purchasing power conversions we account for the fluctuating price levels in each country relative to the US. The picture is largely the same, but the shape of the curves make a little more sense.
The similarity in price changes between the UK, France and Germany are plain to see. They are each competing for similar gas imports. When you consider that taxes make up 5% of UK prices, 16% of French prices and 24% of German prices, this chart makes a good deal of sense.
The US benefits from shale-derived gas sources
The US story is well known, so I won’t rehash it too much here. Net imports of natural gas in the US have halved since 2005, and exposure to LNG has fallen, due to the rise of shale gas. This has given the US remarkably cheap gas compared to many of its OECD peers.
When I look at the price of Japanese natural gas I wonder if Americans really appreciate how cheap their energy is. Japan produces hardly any natural gas and is the world’s largest importer of LNG. Tax is just 5% of the price. Since the closing of nuclear power plants following Fukishima Japan needs even more LNG for power production. This has driven prices even higher.
If at any moment this winter you begin to feel sorry for yourself about how expensive your natural gas is, please spare a thought for the Japanese.
The winter fuel bill for US homes using natural gas last year was $598. In Japan that gas would have cost $2,500!
Natural gas prices in the US states
We also cover in detail natural gas heat prices vs electric heat prices for each state. The data is drawn from the US governments Energy Information Administration so its a lot more detailed.
I guess that explains the Kotatsu?
Lindsay Wilson
I founded Shrink That Footprint in November 2012, after a long period of research. For many years I have calculated, studied and worked with carbon footprints, and Shrink That Footprint is that interest come to life.
I have an Economics degree from UCL, have previously worked as an energy efficiency analyst at BNEF and continue to work as a strategy consultant at Maneas. I have consulted to numerous clients in energy and finance, as well as the World Economic Forum.
When I’m not crunching carbon footprints you’ll often find me helping my two year old son tend to the tomatoes, salad and peppers growing in our upcycled greenhouse.