What is climate change? Man made climate change is the variation in climate caused by human activity. The increasing concentrations of greenhouse gasses in our atmosphere are causing the earth to warm and the climate to change. To slow down this process, and stabilise the climate, we need to reduce our greenhouse gas emissions.
This step will cover evidence of climate change, causes of climate change, impacts of climate change, solutions to climate change and uncertainty. If you’re interested in a high level summary, we devote an article on the definition and observations of climate change. We also introduce great documentaries on the topic if you want more sources of laymen’s information.
Evidence Of Climate Change
Although climate change is a relatively slow moving process, its effects already with us.
The Intergovernmental Panel on Climate Change (IPCC) is the body set up to study climate change. In 2022 they released their sixth report, available here. Back in 2007, the fourth assessment report stated that:
‘Eleven of the last twelve years (1995-2006) rank among the twelve warmest years in the instrumental record of global surface temperature (since 1850).’
Global average temperature increased 0.74°C (1.33°F) from 1906 to 2005. In terms of a rate of change, 0.74°C in a century is very fast. The majority of this change occurred in the second fifty years of that period.
A good example of this temperature change is shown by the data from NASA’s Goddard Institute for Space Studies:
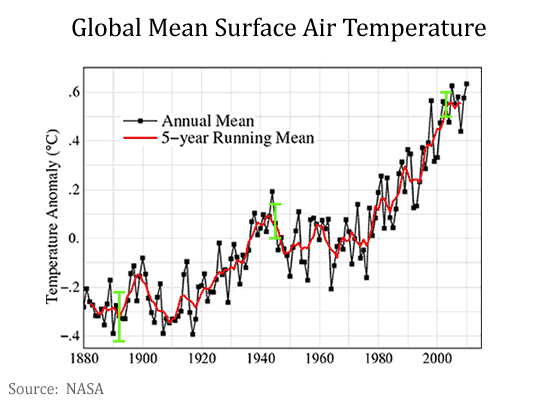
In this case the baseline is set for the 1951-80 average with both the annual mean and 5 yearly mean surface temperatures shown. It shows that 2010 was the equal warmest year on record, tied with 2005. The effects of this temperature increase have been seen in the decline of average snow cover in recent decades and gradual sea level rise, due largely to thermal expansion of the oceans.
Causes Of Climate Change
The earth’s climate changes constantly and has done ever since it began some 4.5 billion years ago. The earth has gone through many different cycles, from ice ages colder than today to interglacial periods hotter than present. These changes were driven in large part by changes in the earth’s orbit, its tilt and rotation, volcanic eruptions, the varying intensity of the sun and changes in natural stores of greenhouse gasses.
The role of greenhouse gasses, and the well-known ‘greenhouse effect’, has always been important to the earth’s climate. While most solar radiation is absorbed by the earth some of it bounces off in the form of infrared radiation. Some of this reflected heat is then trapped by greenhouse gasses in the atmosphere warming both the earth surface and the lower atmosphere. Without this protective blanket of greenhouse gasses to catch reflected heat the earth would be around 33°C (60°F) colder than it is.
Since the industrial revolution mankind has begun producing greenhouse gasses on a level significant enough to affect the atmosphere, causing man made or ‘anthropogenic climate change’. In terms of human impact the most important greenhouse gasses are the long lived ones we count in the carbon footprint.
To understand our growing emissions of these gasses we can look at the same global footprints we analysed in the first step of this guide, but this time split it in terms of gasses
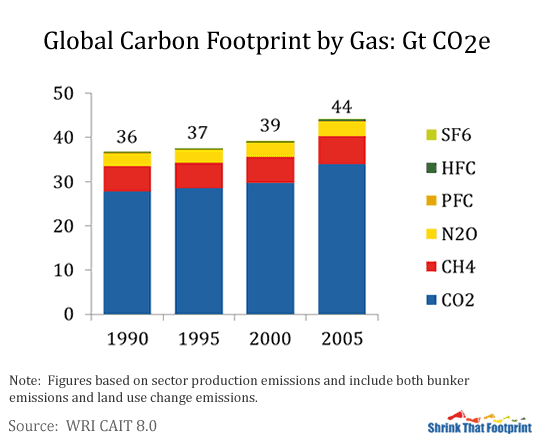
From this graph it is easy to see why there is so much focus on carbon dioxide. Throughout the period of 1990 to 2005 it accounted for more than 75% of total emissions. On top of this CO2 accounted for around 80% of the growth in total emissions, meaning it is becoming more important with time. This growth is being driven by the combustion of fossil fuels like coal, oil and gas for energy production and industrial process.
As we emit more greenhouse gasses their atmospheric concentrations rise trapping additional heat. The most important example of this is CO2. Ice core samples show that over the last 400,000 years the concentration of atmospheric CO2 has fluctuated between 180 and 290 ppm (parts per million) in strong correlation with temperature. During this period the natural release of CO2 by vegetation and the oceans was largely matched by natural absorption in what is often called the ‘carbon cycle’.
Since the industrial revolution the additional emissions of CO2 caused by human activity have unbalanced this cycle. Although human activity adds as little as 5% to annual natural emissions of carbon dioxide, these additional emissions can not all be absorbed. Despite an increase in the absorption of CO2 by vegetation and the oceans as much as half of human emissions end up staying in the atmosphere, thus increasing the concentration of atmospheric CO2.
The atmospheric concentration of CO2 has increased from around 280 parts per million (ppm) in 1850 to 390 ppm in 2010, a rise of 40%. The most famous measurement of this phenomenon is the ‘Keeling Curve’ which has measured CO2 concentrations at Mauna Loa observatory in Hawaii since 1958 .

The unrelenting upward trend of the black annual mean line shows the effect human CO2 emissions have had in recent times. The atmospheric concentration of CO2 has risen from 320 ppm to 390 ppm in the 50 years between 1960 and 2010.
The up and down movement of concentrations over the year is sometimes called the ‘breathing of the earth’. This occurs because the earth has more land and vegetation in the Northern hemisphere. The CO2 concentration increases in Northern winter because photosynthesis declines as leaves drop but plant respiration continues. The concentration drops again in the Northern spring when photosynthesis begins again in earnest, absorbing carbon dioxide from the atmosphere.
Just like carbon dioxide, the atmospheric concentrations of methane (CH4) and nitrous oxide (N2O) have also increased since pre-industrial times. Methane concentrations have increased from around 700 ppb (parts per billion) in pre-industrial time to around 1800 ppb in 2010, while nitrous oxide concentrations have gone from 270 ppb to 320 ppb over the same period.
To understand how these changing concentrations affect the earth’s climate, scientists use a concept called radiative forcing. Radiative forcing measures the change in energy balance between incoming and outgoing radiation energy in Watts per square metre (W/m2). It is useful because it allows a summation of all the different ways in which human activity affects the climate through both positive forcings and negative forcings.
In their fourth assessment report the IPCC estimated the radiative forcing of climate between 1750 and 2005 to have a net value of around 1.6 W/m2. Which was roughly equal to the warming effect of carbon dioxide by itself. All the other positive forcings totaled around 1.5 W/m2. This included other long lived greenhouse gasses like methane, nitrous oxide and chlorofluorocarbons, together with shorter lived agents like tropospheric ozone and black carbon. These positive forcings were balanced by around – 1.5 W/m2 of negative forcings, which we dominated by the direct and indirect effect of aerosols. An estimate which has a significant degree of uncertainty.
How much the climate is affected by these forcings is often called ‘climate sensitivity’. The standard estimate of climate sensitivity is for a forcing equivalent to the doubling of CO2, or around 3.7 W/m2. In its fourth assessment report the IPCC stated climate sensitivity was ‘likely to be in the range 2 to 4.5°C with a best estimate of about 3°C‘. This estimate includes significant positive feedbacks without which climate sensitivity would be around 1.2°C. By estimating the net forcing and how sensitive the climate is to that forcing scientists work to understand past, current and future climate change.
Taking the time to understand the key ideas of climate ‘forcings’ and ‘sensitivity’ helps us to understand the key drivers of climate change. It also gives you a better understanding of things climate scientist understand well, like carbon dioxide, and those things they understand less well, like aerosols and the mixing of the deep ocean. For anyone interested in gaining a better understanding of these ideas the assessment reports of the IPCC are a good place to start.
Impacts Of Climate Change
As a result of the increased concentrations of greenhouse gasses in the atmosphere the earth is expected to warm significantly over this century. How much it will warm isn’t clear due to the uncertain path of future emissions, a limited understanding of important components like aerosols and the enormous complexity of the climate system.
In its 2007 report, the IPCC compared different a number of different scenarios for which warming over this century was predicted to be between 1.1°C and 6.4°C (2°F to 11.5°F), with best estimates from 1.8°C and 4.0°C (3.2°F to 7.2°F). This warming is on top of the 0.7°C (1.26°F) already observed the last century.
To estimate future warming they modeled scenarios that considered how the possible changes in the economy, population and technology might affect greenhouse gas emissions. Using these emissions forecasts they then projected the resulting change in temperature:
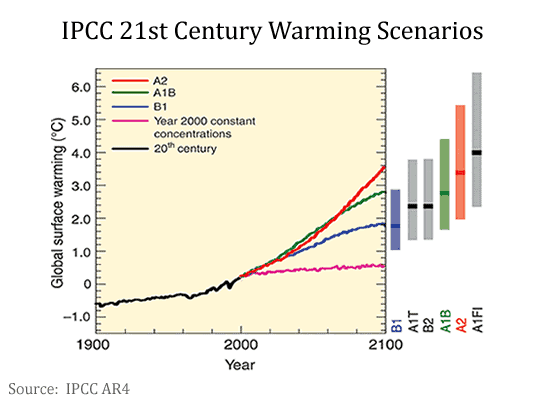
The pink line assumes constant year 2000 concentrations and is not really a scenario, but just gives us an idea of what would happen if atmospheric concentrations were to remain stable at year 2000 levels. It predicts warming over this century of 0.6°C (1.1°F).
The blue B1 Scenario describes a world where population levels off by 2050 and there is a rapid transition to a service based economy with widespread deployment of clean energy technologies. It predicts warming over this century with a best estimate of 1.8°C (3.2°F).
The green A1B Scenario assumes rapid economic growth, a population that peaks mid century and increased adoption of clean energy technologies. Based on these parameters it predicts warming over this century of 2.8°C (5°F).
The red A2 Scenario assumes stable economic growth, high population growth and limited transition to clean energy technology. It predicts warming of 3.4°C (6.1°F) by the end of the century.
One important thing to remember is that warming is not expected to be uniform. The image below is a heat map which shows the predicted warming for the earth this century under the green A1B Scenario.
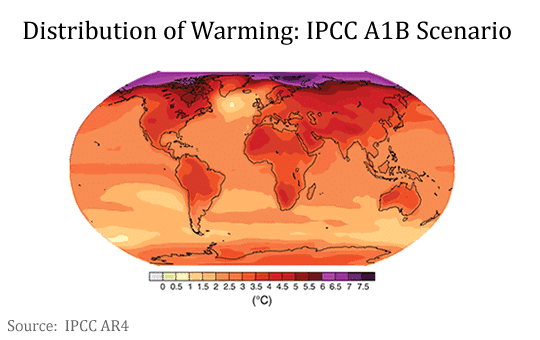
In it northern latitudes are expected to see higher temperature rises, with the arctic being particularly affected. Also land areas further from the sea are expected to see greater warming.
These scenarios paint a picture of temperature change on a level that will alter the earth substantially, affecting our ecosystem, society and economy. While there may be some potential benefits from these changes, the speed and scale of potential climate change is very concerning.
The following is a short summary of potential changes listed in the IPCC’s 4th Assessment Report:
The ecosystem: temperature increase threatens widespread species extinctions and a large scale erosion of biodiversity. Resources like freshwater, forests, fisheries and arable land could come under increasing stress. Coral reefs would face widespread mortality. Extreme weather events like flooding, drought and tropical storms may become more common.
Food production: World food production capacity may increase with initial warming, but this will depend on geography. Countries at northern latitudes in particular may see increased potential for food production while at lower latitudes crop production is expected to decrease for any warming.
Human health: the effects of climate change on health may vary a lot with region. Many central and lower latitude areas could be adversely affected, with increased likelihood of malnutrition, water-borne and respiratory diseases. On the contrary some temperate areas may well benefit from warming, particularly those where exposure in colder months is a problem.
The economy: like health and food, the effects of climate change on the economy are likely to vary enormously with geography. Coastal areas, flood plain communities and those at risk of fresh water stress could suffer most. Various economic studies estimate the global cost of 3°C (5.4°F) of warming to be between 1 and 5% of GDP, but these results vary greatly depending on scope and discounting.
Fresh water: reduced snow cover and melting glaciers are expected to result in increased runoff in many areas for the first couple of degrees of warming, particularly in eastern and southern Asia. Rainfall patterns may change significantly. Many semi arid areas like the Mediterranean basin, the western states of the United States, southern Africa and the west of Australia could see increasing droughts while other area may see increased rainfall.
Sea level: Sea level is projected to increase between 18cm to 59cm over the next century. For low lying coastal communities this could cause significant problems. The potential for feedbacks and dynamic changes resulting from glacier melt, particularly from Greenland, is a large concern. These feedbacks could possibly result in much higher sea level rises and are an area of much study.
As is clear from this summary, the negative consequences of climate change are unlikely to be evenly shared around the globe. Poorer countries less able to adapt to climate changes and the natural world are likely to be disproportionately affected.
Solutions To Climate Change
The most obvious solution to climate change is to reduce global emissions of greenhouse gases, and in particular carbon dioxide. This is often called climate change mitigation. The vast majority of climate change policy is aimed at mitigation. Though this section will focus largely on mitigation it will also touch on two other responses to climate change, adaptation and geo-engineering.
Climate Change Mitigation
The main approach to limiting climate change is to reduce greenhouse gas emissions, as well as enhance natural sinks that remove them, in what is generally called climate change mitigation.
To help guide mitigation policy the fourth IPCC report summarised how much warming might occur given various stabilisation levels of greenhouse gas concentrations and other forcing agents in the atmosphere. The following table is a simplified version of this summary:
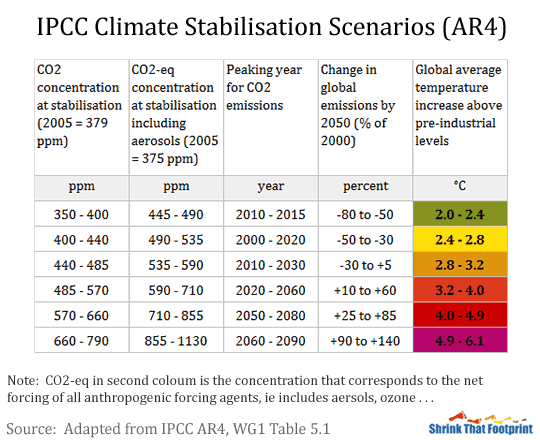
In terms of stabilisation, most international targets are viewed in terms of the net CO2 equivalent concentration (CO2-eq) listed in the second column. This concentration represents the net forcing of all forcing agents in the atmosphere in terms of their CO2 equivalency. It includes the negative forcings agents like aerosols along with positive forcings agents like CO2, methane and nitrous oxide. Climate targets tend to emphasize this number, as it considers all the things affecting climate change.
To make things simpler to understand this table also includes a stabilisation concentration of CO2 to match the CO2-eq scenario. This is given in the first column. Confusingly, many people often conflate these two numbers. So it is important to understand the difference. For each of the stabilisation scenarios the table shows the peaking year of CO2 emissions and how much they would need to change by 2050, relative to 2000, under that scenario. The temperature increases shown indicate how much above pre-industrial temperatures the climate would peak at, so they include warming that has occurred in the last century.
The most widely held target internationally is the goal of limiting global temperature increase to 2°C (3.6°F), a target seen as limiting the risk of catastrophic climate change. To have any chance of reaching this goal we would need to begin reducing emissions immediately and reduce CO2 by 80% in 2050 compared to 2000 levels. On current projections reaching this target looks highly unlikely, in fact CO2 emissions are expected to increase significantly by 2050.
To understand what these stabilisation scenarios might look like it is useful to think of them in terms of emissions pathways, that is, how the global carbon footprint might develop over the next century. A good example of these pathways was presented by United Nations Environment Program (UNEP) in their 2010 Emissions Gap Report, which analysed the shortfall of promises made in 2009 Copenhagen Accord.
The report focuses on emissions pathways likely to limit warming by the end of the century to certain thresholds. The following chart shows their findings:
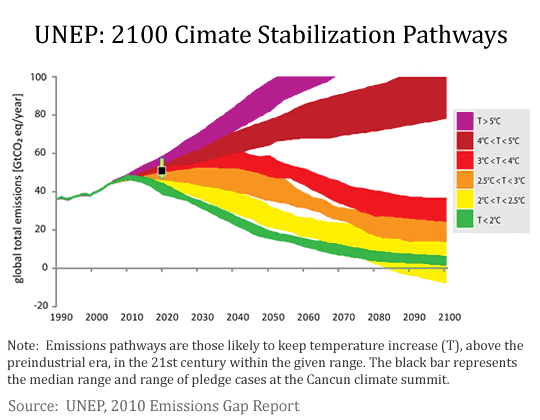
The most ambitious green pathway corresponds to emissions reductions consistent with achieving the 2°C (3.6°F) target for the 21st century. It implies a reduction of the global carbon footprint from roughly 50 Gt CO2e in 2010 to at least 20 Gt CO2e by 2050. In stark contrast to this, current emissions projections for 2050 are around 80 Gt CO2e, which is consistent with a pathway corresponding to at least 4°C (7.2°F) of warming this century. This comparison shows very clearly the enormous gap between the action demanded by a 2°C (3.6°F) target and the current trajectory of emissions growth.
Reducing global emissions to 20 Gt CO2e by 2050 requires a global shift away from dependence on coal, oil and natural gas, combined with reduced net emissions from agriculture and deforestation. Achieving such ambitious emissions reductions in a period of growing energy demand, particularly from developing countries, is proving very difficult. It is an enormous challenge requiring technological innovation, creative policy and individual action to produce products and services with fewer and fewer embedded emissions.
Despite widespread agreement on the need to act global emissions are continuing to rise. While many countries have emission reduction targets, success in meeting them is limited. How successful such mitigation efforts are in the next few decades will determine the scale of warming we are likely to see this century.
Looking at emissions pathways and global targets is an easy way to demonstrate the scale of climate change mitigation necessary to limit warming to 2°C (3.6°F). For individuals however these pathways can be hard to relate to. To overcome this problem the next step will convert these emissions pathways into personal carbon budgets for the coming decades, helping to understand the role individuals can play in mitigation efforts.
Adaptation
As its name suggests adaptation is not so much about limiting climate change as learning to live with it. Given the earth could potentially warm by 1.4°C to 4.0°C (2.5°F to 7.2°F) this century it would be foolish not to prepare for the effects of this. This preparation requires anticipation of climate changes, investment in infrastructure and wide-scale organisation.
All potential climate change effects present challenges for which preparation will be useful. Things like water shortages, extreme weather events, rising sea levels and food insecurity are already concerns in many countries, and are likely to become more pressing issues with continued warming. Adaptation to these changes will be varied depending on geography and capacity.
One of the great ironies of climate change is that many people in developing countries, who have played virtually no role in contributing to climate change, are the most exposed to its effects. Their exposure to things like sea level rises and failing rains, combined with limited means to adapt to them, makes them particularly vulnerable to the effects of climate change. Despite attempts to secure funding for adaption programs from wealthier countries many developing countries still have limited capacity to adapt.
Geo-Engineering
Geo-engineering, also known as climate engineering, is a set of ideas for manipulating the earths climate to counteract the effects of climate change. Although most geo-engineering techniques are still theoretical they are increasingly considered as a complimentary strategy to mitigation and adaptation. The most commonly discussed ideas come in two main areas: solar radiation management and greenhouse gas remediation.
Solar radiation management seeks to limit the amount of sunlight hitting the earth or to increase the earths reflectivity. Examples of this include stratospheric aerosol insertion, marine cloud whitening and crop modification. These ideas propose reflecting more sunlight away from the earth to help cool the planet using sulfurous particles injected into the atmosphere, creating clouds from sea water and growing more reflective crops.
Greenhouse gas remediation seeks to address the problem of greenhouse gas concentrations by removing them from the atmosphere to be stored in some way. Suggested methods are air capture, ocean fertilisation and biochar. Air capture would remove CO2 directly from the air. Ocean fertilisation creates algal blooms that do this. And biochar sequesters carbon dioxide by burying charcoal made from biomass in the earth.
Despite being extremely contentious research in to climate engineering is likely to increase in the future, as it has the potential to play a significant role in limiting climate change.
Uncertainty
Before finishing this step it is worth saying a word about uncertainty.
The enormous complexity of the climate means there will always be uncertainty in any predictions of future climate change. There is a level of uncertainty in the understanding of climate forcings, the things affecting our climate, and in particular the role of aerosols and cloud formation. There is also uncertainty as to how sensitive the climate is to these forcings. Furthermore there is uncertainty as to how quickly the earth’s surface temperature will respond to these changes due to an incomplete understanding of how heat is absorbed and mixed in the oceans. Finally there is uncertainty as to what our future emissions will be and which technologies we have to reduce them.
Given these uncertainties and the complexity of climate science it is easy to question what we should do. Rather that this being an excuse for inaction, uncertainty is the major reason why we should act. We need to insure the planet against the most extreme possibilities of climate change.
The best science we have estimates potential warming over this century of between 1.1°C and 6.4°C (2°F to 11.5°F). The lower end of this range would bring total warming to around 2°C (3.6°F) above pre-industrial levels, an increase that would hopefully avoid the very worst effects of climate change. However, warming towards the upper end of this range could be truly catastrophic for the natural world, human health and the economy. Uncertainty is not our friend when it comes to climate change. We need to do everything we can using the best science, technology and policy we have to reduce the risks of catastrophic climate change.
The analogy of insurance is perhaps the best way to think about climate change action. We are better to insure against the possibility of catastrophic climate change only to learn its risks are overstated, than to choose inaction only to realise we had underestimated its severity.
Summing Up
In this step we have seen how the earth has warmed in the last century. We have looked at the causes of climate change and its potential impacts. We have seen the type of mitigation that is necessary to limit climate change to 2°C (3.6°F) and briefly discussed adaptation and geo-engineering. Finally we have shown why the uncertainty associated with climate change is the major reason why we need to act.
Lindsay Wilson
I founded Shrink That Footprint in November 2012, after a long period of research. For many years I have calculated, studied and worked with carbon footprints, and Shrink That Footprint is that interest come to life.
I have an Economics degree from UCL, have previously worked as an energy efficiency analyst at BNEF and continue to work as a strategy consultant at Maneas. I have consulted to numerous clients in energy and finance, as well as the World Economic Forum.
When I’m not crunching carbon footprints you’ll often find me helping my two year old son tend to the tomatoes, salad and peppers growing in our upcycled greenhouse.