Introduction – Food Footprint
Your food footprint is invariably an important part of your personal footprint.
For the less affluent it is often the biggest source of emissions, and only makes up a smaller share as people have more to spend on housing, travel or products.

This step will focus on what food footprints are, food waste, the carbon intensity of food, different diets and food miles. It will also briefly discuss cooking, food storage and land use emissions. Most of what we talk about is your personal behavior. But if you’re interested in having an impact beyond your own life, consider getting a job in sustainable food. That way you can have impact on other people as well.
Food Footprints
A person’s food footprint (foodprint) is all the emissions that result from the production, transportation and storage of the food supplied to meet their consumption needs. We chose to focus on food supply, rather than only food consumption, because a large proportion of food is lost at retail and consumer level. Although emissions also occur when people transport, store and cook food, these emissions are omitted from our calculations as they are captured in travel and housing footprints.
Just like in any other analysis of food it makes sense to think of our food footprint in terms of different food groups. Using a combination of LCA and IO-LCA analysis together with average food consumption statistics we can estimate what a typical food footprint looks like.
As usual we use the average US consumer for our example:
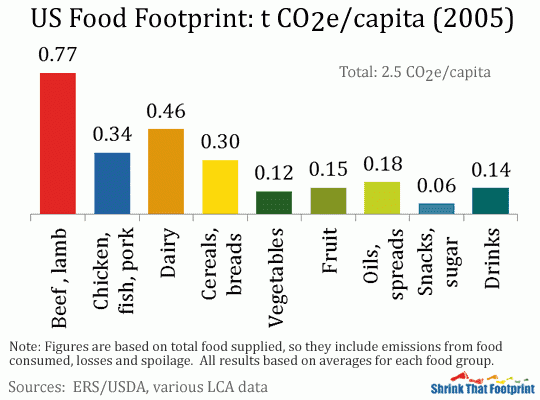
The average US food footprint is roughly 2.5 t CO2e. The biggest sources of emissions are from the beef (0.8 t), dairy (0.5 t) and chicken (0.3 t) food groups. This isn’t because these food groups dominate intake in the US diet, but rather that they are relatively carbon intensive to produce, in particular beef and dairy.
More carbon footprint numbers of various foods are available from our parsing of the scientific literature in our food carbon footprint database. Note that estimates of carbon footprints are imprecise because they can’t be measured directly. Therefore you’ll see differences between different sources. Take it to mean differences in the rank, or perhaps relative differences. For example in any publication you’ll find beef is more carbon intensive than chicken but the actual numbers will differ.
The remaining food footprint is reasonably well distributed across other groups like cereals, vegetables, fruit, oils, sugars and drinks. In terms of shares, the footprint breaks down like this:
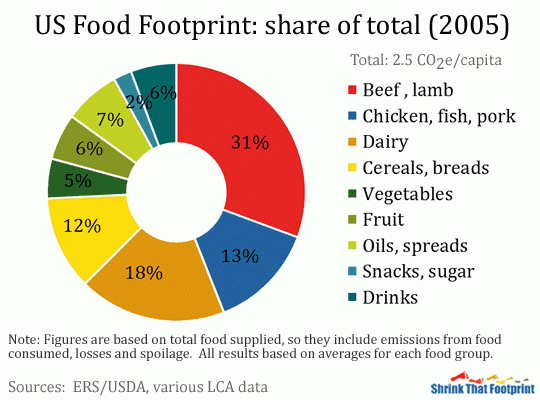
The dominance of beef (31%), dairy (18%) and chicken (13%) is quite clear, accounting for 62% of the total footprint. In some ways this is logical, because before animal products can be consumed the animals must first be reared using feed, which itself can be quite carbon intensive to produce.
What this footprint doesn’t show us is the fact that around 45% of these emissions arises from the production of food that is never eaten. Such ‘food losses’ are a very important part of our food footprint and represent a large opportunity for shrinking it.
Food Waste
The simplest and most cost-effective way to reduce your food footprint is to minimise food waste. Although not all food waste is within your control, your purchasing and cooking habits can play a large part in reducing food losses.
Before discussing ideas for reducing food waste emissions it is worth looking at some data to help us understand the scale of food losses. As with our footprint example we use information from the US Department of Agriculture, specifically data on food availability and adjustments for losses.
For each of our food groups we divide total food supply into three groups: retail losses, consumer losses and consumption. Each are expressed as a share of total food supplied. Retail losses are food that is supplied to stores but never sold, due to spoilage and processing. Consumer losses are food purchased but not eaten due to a combination of spoilage, the non-edible share of food, cooking waste and plate waste. Consumption is the portion of total food supplied that is actually eaten.
The data looks like this:
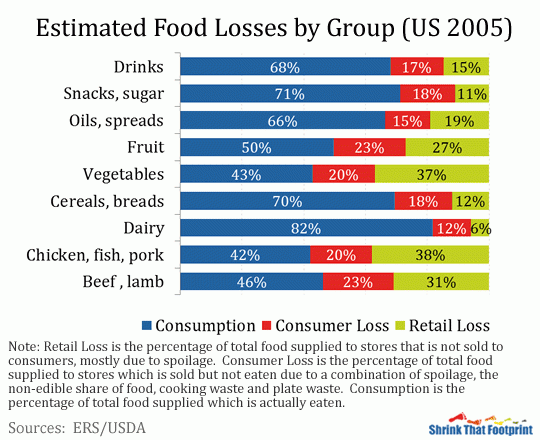
Even though not all food supplied can be eaten (eg bones, cores, skins), the scale of food loss is still surprising. While small amount of fresh food can be lost during repackaging within stores, the vast majority of retail losses occur because shops are unable to sell food before it goes out of date. In fruit, vegetables, chicken and beef this is more than a quarter of all food supplied.
Consumer losses are between 10% and 25% of total food supplied for each group, meaning that as a share of purchased food they are actually much higher. Take the beef example, 23% of total supply is consumer loss, which corresponds to a loss of 33% of purchased food. Consumer losses are made up of food that is non-edible, allowed to go out of date, wasted during cooking or wasted from the plate.
With the exception of the non-edible share of food you can generally make large reductions in your food footprint by simply ensuring that you eat everything you buy. Doing so just takes some common sense and is action we would naturally take if food was more expensive or scarce.
By being careful about the portions you cook, eating what you cook or storing leftovers, you can easily reduce plate waste. By being careful about what you buy, eating perishable things on time and being less squeamish about used by dates where sensible, you can also minimise food spoilage in your home.
A large proportion of retail losses is food that is perfectly fine to eat but is discarded due to supermarket caution and food aesthetics. Although retail losses are largely out of our hands we can still affect them to a degree. Buying food which is close to its ‘best before’ date often avoids such waste. This makes sense if you know you are going to eat it soon after purchase and such food will often be subject to discounts.
By reducing food waste you may be able to shrink your food footprint by as much as a quarter. Although it can be hard to quantify this improvement in your calculations, limiting food waste should result both in a reduction in your kitchen waste volume and food costs. As such reducing food waste is the natural place to start shrinking your food footprint.
The Carbon Intensity Of Food
The great variation in how foods are produced, processed and transported means their footprints are very different. The vast majority of emissions, typically around 80%, occur during food production. This means how your food is produced is the most important factor in your food footprint.
Unlike in other sectors of your personal footprint, which are typically dominated by carbon dioxide emissions, both nitrous oxide and methane play an important role in food production. Nitrous oxide emissions are significant in most food groups due to the widespread use of nitrogen based fertilizers in agriculture. In the US nitrous oxide emissions makes up around a third of total food emissions. Methane emissions occur mostly due to enteric fermentation in animals like cows, sheep and goats so they are largely limited to the beef and dairy food groups. Despite this, methane emissions account for around a quarter of total food emissions in the US.
By using weighted averages for the production of foods within each group we can calculate an average carbon intensity for each. Although such averages aren’t accurate for specific foods, they are very good for assessing complete diets.
Our example looks like this:
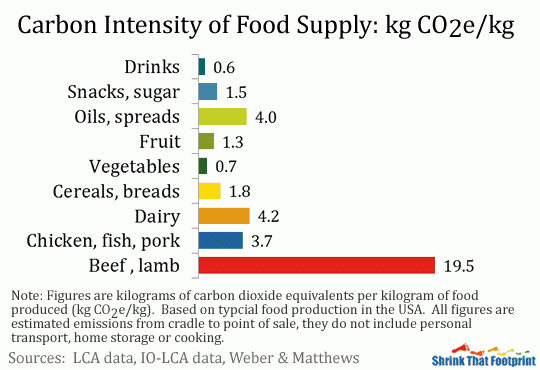
These figures are in terms of kilograms of carbon dioxide equivalents per kilogram of final product (kg CO2e/kg). Beef is by far the most carbon intensive, while dairy and chicken are also quite high. This is because beef and lamb production requires significant amounts of feed and the animals also produce large amounts of methane during their life. In contrast drinks and vegetables have relatively low-carbon intensity because their produce is both quite heavy and uses limited energy inputs.
When thinking about your whole diet these figures are very useful, but it is important to remember that they are only averages. Dairy is a good example. Although the value for the dairy food group is 4.2 kg CO2e/kg this masks large variety within the group. Hard cheese is typically more than 10 kg CO2e/kg while milk is on average somewhere between 1-2 kg CO2e/kg . Such variation exists within all food groups and is a significant source of potential error when calculating your own footprint.
Although the standard functional unit for the life cycle analysis of food is kg CO2e/kg, it can be more useful when analysing diets to think in terms of food energy (kcal). Using food group averages from the US Department of Agriculture we can look at our intensities in terms of food energy rather than weight. The kilocalorie (1000 calories) is commonly used when discussing food energy and a typical adult needs to eat something like 2000-2500 kcal each day.
Having converted our intensities to food energy we also want to account for the emissions from retail and consumer losses. By dividing our intensities by one minus the percentage loss for both consumer and retail losses, we produce intensities in terms of grams of carbon dioxide equivalents per kilocalorie (g CO2e/kcal) of food eaten. This captures all the emissions from the food the food typically supplied for each kilocalorie consumed.
The intensities now look like this:
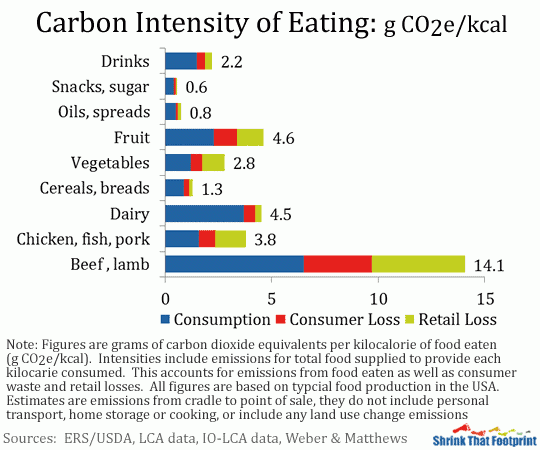
After being adjusted for energy content and losses, our results look similar but there are subtle changes. Because of their high energy content snacks, oils and cereals are the least carbon intensive ways to supply food energy. Beef at 14 g CO2e/kcal remains the most intensive while fruit, dairy and chicken are also relatively high. Again, these are weighted averages so within each group there may be wide variation depending on production methods, food losses and energy content.
Using food energy rather than food weight to assess footprints is very useful, because it gives us an idea of the most and least carbon intensive ways we can supply our energy needs. Although daily kilocalorie intake is not the only important factor in diet, it is a simple and clear way to think about different diets while ensuring estimated consumption is in a reasonable range. And the better you understand the carbon intensity of the food you eat, the more effectively you will be able to reduce your footprint.
Different Diets
Because the majority of food supply emissions occur during production, changing your diet is the most effective way to shrink your footprint. Reducing your consumption of beef, lamb and dairy products will have the largest effect, due to their high carbon intensity. Additional reductions may also be found by limiting consumption of other meats and certain types of fruits.
Choosing to switch food consumption from high carbon intensity foods (eg beef, cheese) to low-carbon intensity foods (bread, potatoes, grains) can reduce emissions by as much as 90% for that food consumption. Although it would be ideal to compare individual foods we can demonstrate this idea using food groups alone.
To do this we assume a diet of 2,600 kcal of food energy is consumed each day, which is roughly equal to an average American intake. Using our food groups we compare four sample diets: Meat Lover, Average, No Beef, Vegetarian and Vegan. Each consists of 2,600 kcal of daily food intake, and uses the same intensities for each food group, so the only thing that varies is the relative consumption between groups.
The breakdown of food energy across the groups in each diet look like this:
Each of these diets are a variations on the average diet. We assume the Meat Lover eats more red meat, white meat and dairy in place of some cereals, fruit and vegetables. The No Beef option switches all beef consumption to the chicken group. The Vegetarian switches away from beef and chicken to fruit and vegetables, while also reducing oils and snacks. The Vegan does much the same as the vegetarian while also eliminating dairy through further switching to cereals, fruits and vegetables. Despite all these changes 60% of food energy comes from exactly the same sources in all four diets of these diets.
Using our average carbon intensities for each food group we can calculate a footprint for each of these diets:

Despite the fact that 60% of each of these diets are the same, the footprints vary greatly. The ‘Average diet’ is based on the typical American diet so has the same footprint of 2.5 t CO2e. The Meat Lover is 3.3 t, No Beef 1.9 t, the Vegetarian 1.7 t and the Vegan 1.5 t.
For the Meat Lover beef consumption is almost half of the total footprint despite being only 11% of food energy. Together with chicken and dairy it accounts for almost 80% of the Meat Lovers footprint. Animal products create about 60% of the Average foodprint but are only a quarter of food energy. The No Beef diet highlight that switching less than 10% of consumption from beef to chicken slashes the foodprint. While the difference between Vegetarian and Vegan diets arises from around 200 kcal a day switched from dairy to cereals and vegetables.
The 60% of each diet that is constant across these diets accounts for around 1600 kcal of energy and 0.7 t of the total footprint. So all the variation in footprints depends on the remaining 1,000 kcal per day. The Vegan gets these 1000 kcal for 0.8 t, the Vegetarian for 1 t, The No Beef for 1.9 t, the Average for 1.8 t and the Meat Lover for 2.6 t. Obviously this is a result of the great differences in the carbon intensity of different food groups.
Using data for the average food groups, these sample diets shows the potential that changing diet has to reduce food footprints. And these examples on consider the average of each food group, so there is even more scope to reduce your by focusing on individual food types. If someone was to get 2,600 kcal a day purely from potatoes this might result in an annual food footprint of just 0.2 t, while if these 2,600 kcal were instead all from beef the footprint might be around 14 t. Obviously no one eats a single food diet, but this rather silly example highlights just how much potential changing diet has for reducing our food footprints.
Trying to change you own diet habits is a pretty personal thing. You may find it easy to reduce beef consumption but be addicted to cheese. Generally though, there will always be a simple way to start. You could try being vegetarian, or vegan, for a day at a time to see what you miss and what you don’t. Between learning more and experimenting with your diet you may be able to make very large reductions that also benefit your health, and possibly your bank balance.
Food Miles
Despite often being highlighted in the media the significant distance that much of our food travels is not the major source of food emissions. This is confirmed by bottom up studies of individual foods and well as top down studies of entire food supply markets. Although this varies from country to country, a rough guide of food supply emissions is something like 80% production, 10% transport and 10% storage at wholesale and retail level.
Transport emissions are in fact dominated by the upstream emissions of moving food stuffs to production facilities, with the remainder of transport emissions being from delivering final products to wholesalers and retailers. Reducing these transport emissions can help reduce total emissions, but only if it makes sense in the context of the foods’ entire footprint. Foods for which transport is a significant factor are often those which are shipped by air due to their perishing quickly and having high value per unit weight. If you’re interested in hands-on exploration take a look at our page for how to grow what you eat.
The importance of the transport mode used can be shown by comparing freight transport emissions:
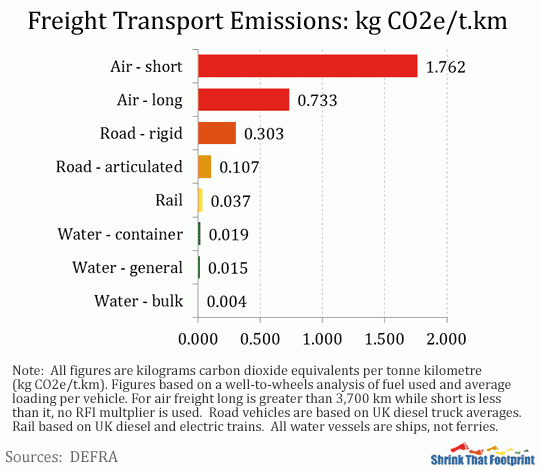
Each of these figures is in terms of kilograms carbon dioxide equivalents per tonne kilometre (kg CO2e/t.km), and is based on international and local data from DEFRA in the UK. Air freight is unsurprisingly carbon intensive while small trucks (Road – rigid) also have relatively high emissions. Shipping by contrast is a very low-carbon way to move goods.
As we can see from this data, a fruit or vegetable that is not in season and brought in from overseas has the potential to have large emissions from transport, particularly if it is flown. Nonetheless, this still needs to be considered in the full context of the foods carbon footprint. Tomatoes are a classic example. Tomatoes grown in the northern European winter can be as much as five times more carbon intensive than those shipped in from Spain. This is because the extra emissions that result from lighting, heating and feeding greenhouses locally can far exceeds the emissions required to import Spanish tomatoes.
For anyone interested in gaining a much more thorough understanding of food transport emissions in the context of total food emissions there is a very comprehensive 2008 study by Christopher L. Weber and H. Scott Matthews. Food-Miles and the Relative Climate Impacts of Food Choices in the United States gives a hugely detailed analysis of US food supply, and highlights the relative importance of transport emissions, compared to production and storage emissions.
Examples such as the Spanish tomatoes stress why it is important to consider food transport within the context of a foods entire supply footprint. In this way, ‘food miles’ should just be viewed as part of the overall carbon intensity of a food’s supply. In certain cases, particularly those involving air freight, eating more local and in season produce will help to reduce total food supply emissions.
Thus far this step has focused on reducing emissions from food supply by reducing food waste, shifting diet to less carbon intensive foods and minimizing food miles where appropriate. Although these are the three main strategies to reducing your food footprint, the cooking and storage of food also creates important emissions that have not been included in our analysis.
Cooking And Storage
After its sale, food is generally transported home, stored and often cooked before being eaten. Because emissions from these processes are accounted for in our travel and housing footprints, we do not calculate them as part of our food footprint. This is not to say they are unimportant, it merely avoids double counting.
Because fridges and freezers are on all day every day they are often a major use of electricity. In the US refrigeration accounts for 12% of domestic electricity use, which has a footprint of around 400 kg CO2e a year per person . To a limited degree you reduce the electricity your fridge and freezer consume by not setting them too cold, insuring they have proper seals, are well defrosted and located in the coolest area possible. Much more important however is the choice you make when replacing an old fridge and freezer.
In most countries there are efficiency standards, like the A-G energy labelling in Europe and Energy Star in the US, which you can use to inform your choice. While these tell you how efficient the fridge or freezer is for its class they are only so helpful, because they don’t account for size. If you buy the highest class possible, and also keep your fridge-freezer as small as possible given you needs, you will limit how many kilowatt-hours a year your fridge uses. And thus reduce its carbon footprint.
Cooking can also be a significant source of emissions. In the US it is around 200 kg CO2e a year per person per year. In general cooking with gas creates fewer emissions than cooking with electricity, unless you have access to low-carbon electricity. The calculations are very similar to those we used for heating in the housing chapter. Most people however are unlikely to change their oven for the purpose of reducing emissions, so as with fridges this is worth considering if you are looking for a new oven.
Although improving the efficiency of your oven is quite difficult you can still make small changes to your cooking habits to help reduce the associated emissions. Simple things like using a blue flame on gas, putting lids on pots, only using as much water as necessary, and cooking in bulk can all make a difference. Kettles and coffee makers need only be filled with the water necessary. And microwaves are often a less carbon intensive way to cook.
Land Use Emissions
As we stressed earlier in this guide, emissions from land use, land-use change and forestry (LULUCF) are a major part of global emissions. Although these emissions are generally not calculated as part of the food supply footprint, the expansion of agriculture is a major driver of deforestation, which dominates LULUCF emissions.
In 2000 land use emissions were roughly 5 Gt CO2e or 13% of total global emissions, only slightly less than the total for global food supply emissions at around 7 Gt CO2e. More than 60% of these land use emissions occurred in Brazil and Indonesia, largely as the result of deforestation. The major driver of this deforestation was conversion to agricultural land. In Brazil as much as 80% of deforestation occurs due to the reclaiming of land for cattle rearing or growing feeds like soy for cattle. In Indonesia deforestation in recent years has been largely driven by clearing land for palm oil plantations, which as one of the cheapest vegetable oils is used widely in food production.
By helping to drive deforestation the production of beef, soy and palm oil, along with other crops in tropical regions, has a very large indirect footprint. Though these emissions are generally not quantified as part of the food supply footprint, they are hugely important and an additional reason to consider switching away from particular foods.
Summary
In this step we have seen how to analyse our food footprint by using food groups.
We have shown the importance of wasted food in food emissions. Have seen how we can assess the carbon intensity of food supply in terms of weight and food energy. We have highlighted the potential altering our diet has for reducing food emissions, and learned why we need to consider food miles in the full context of food supply emissions. Have noted the importance of cooking and storage emissions. And finally we explained the large impact agriculture has as a driver of deforestation, and hence land use emissions.
In the next step we will look at how you can shrink your products footprint.
Back To The 30 Day Shrink Guide: Introducing the Shrink
Lindsay Wilson
I founded Shrink That Footprint in November 2012, after a long period of research. For many years I have calculated, studied and worked with carbon footprints, and Shrink That Footprint is that interest come to life.
I have an Economics degree from UCL, have previously worked as an energy efficiency analyst at BNEF and continue to work as a strategy consultant at Maneas. I have consulted to numerous clients in energy and finance, as well as the World Economic Forum.
When I’m not crunching carbon footprints you’ll often find me helping my two year old son tend to the tomatoes, salad and peppers growing in our upcycled greenhouse.