Lower Emissions Break Three Decades Of Stagnancy
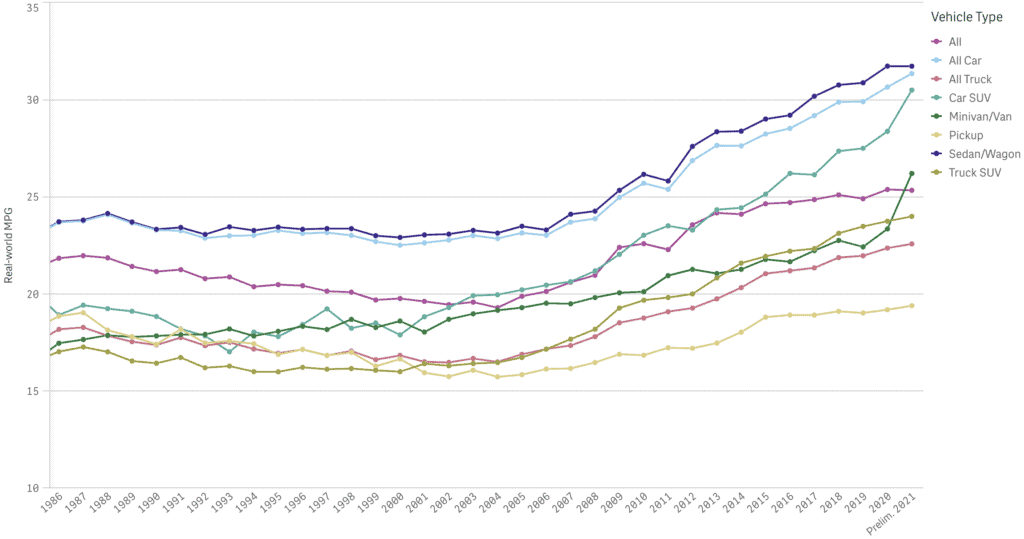
For the last ten years, preceded by three decades of stagnancy, US fuel economy has been rising steadily. Its actually quite something. Fuel consumed peaked in 2004, miles driven in 2006 and vehicle numbers topped out in 2008. Could motorization in the US of peaked? That’s a tough one, but emissions driving emissions definitely did. Further, during the cataclysmic Covid-19 pandemic of 2020, global carbon dioxide emissions fell by 6.4%, or 2.3 billion tonnes. Almost certainly both less flying and less driving contributed to this drop.
Trend Has Persisted For 15 Years
What we do know is that the last time we saw this type of improvement was when the Iranian Revolution resulted in 4.5 million barrels of missing production. In the image above we can see that fuel economy was stagnant for decades as all engineering improvements were eroded by American’s buying bigger and bigger cars. Then trend in MPG ticked upward around 2006 and hasn’t stopped getting better. This is not just a one-time pandemic related event.
Efficiency Up And Emissions Down
The average car in 2021 had an MPG of 25.34 miles per gallon. That is a significant increase from 20 years prior in 2001, when the average car’s MPG was 19.62 miles per gallon. The emissions story is similar. On average for cars, the emitted grams of CO2 per mile went down from a peak in 2004 of 461 g CO2/mile (288 g CO2/km) to 348 g CO2/mile (217 g CO2/km) at present.
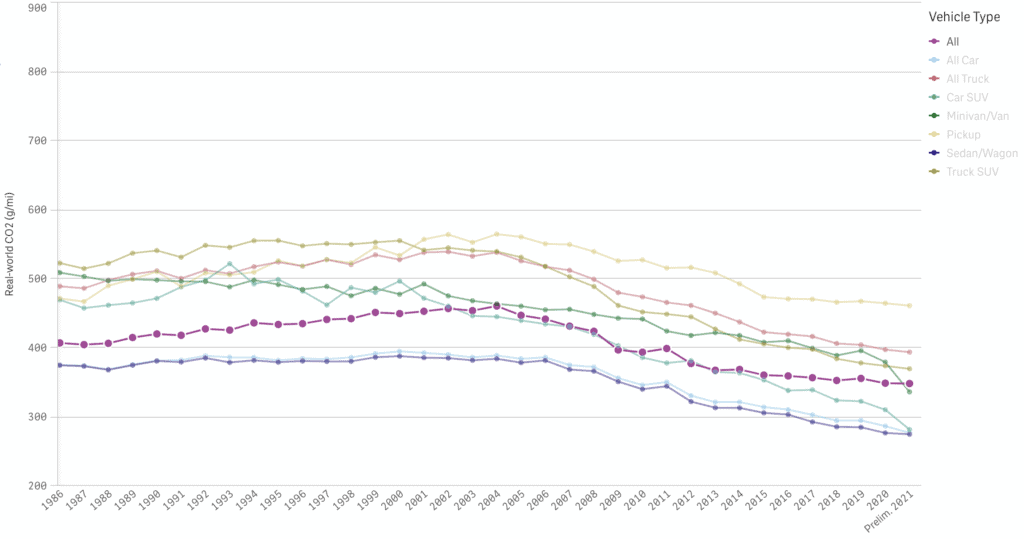
So what has finally changed? Was it the recession? It may have played a part, but it certainly isn’t the whole story. First let’s unpack that headline. A 24% reduction in emissions in twenty years is quite something.
Biden Inflation Reduction Act
In 2022 US President Joe Biden, and the two houses of US Congress, passed a landmark act called the Inflation Reduction Act (abbreviated IRA) that among other things increased incentives for electric vehicles. Given that the law passed only in 2022, it’s definitely not the explanation for the increase in car efficiency and decrease in CO2 emissions from 1986 until 2021. Let’s take a look at the act itself. The act is called “Qualified Plug-in Electric Drive Motor Vehicle Credit” (IRC 30D), and is also known as the Clean Vehicle Credit. It gives a big tax credit to the purchase of new electric vehicles of $2500 up to $7500, depending on the vehicle’s battery capacity and its weight rating. In addition, for cars that are purchased from August to December of 2022, there’s a new requirement that the car’s final assembly must have been in North America. For cars purchased after December 2022, there are requirements for the battery to be made in North America. The incentive is limited to an income ceiling of $150k ($300k married filing jointly). What do we expect this law to do? Well, it’ll recharge the incentivized buying that’s been gradually diminishing over time and maintain pressure on the car efficiency trends to continue.
Eco Driving Arrives in America
The University of Michigan does some epic number crunching on US fuel economy which they keep in the form of the Eco Driving Index. The total EDI for vehicle emissions tells use that an American driver of a new car in March 2014 generated 22% fewer emissions that a similar new driver in October 2007.
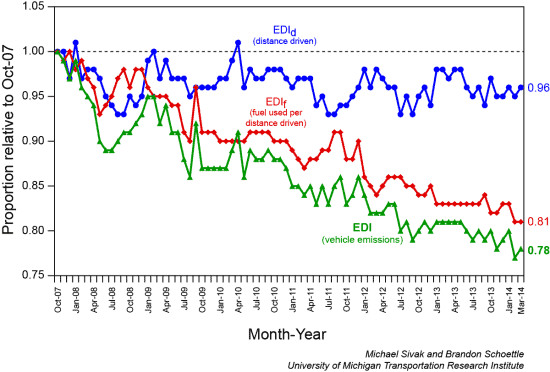
Happily the index is comprised of two sub indexes, allowing us to separate the effect of changes in distance driven and fuel used. From this we can see that the big change is improving fuel economy, with new cars requiring 19% less fuel to cover the same distance as in 2007. Distance driven is off 4%.
Below is a chart the sharp rise in fuel economy of new cars (adjusted to window sticker ratings).
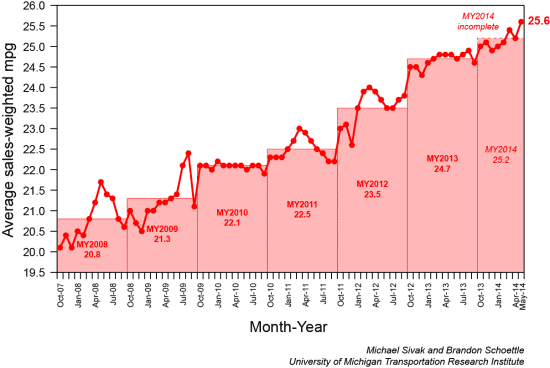
So what happened? Given that the economy is up significantly since the crisis and mileage only down 4% its tough to say how big a part the recession had. It could have helped to skew purchases towards more economic cars, but I prefer the following two explanations.
Obama’s quiet CAFE revolution
Everyone knows the EPA under Obama has been grinding up the corporate average fuel economy (CAFE) standards. It’s not got the column inches of the power regulation proposals of late, but the effect will be profound.
Here’s a chart showing the ramp up:

The Third Oil Crisis
Okay, no one actually calls it this. Krugman jumped the gun in 2002. But we were so busy with global financial crisis a few years back that no one bothered to get excited about it rising oil prices.
Just indulge me a little. Look at this chart:
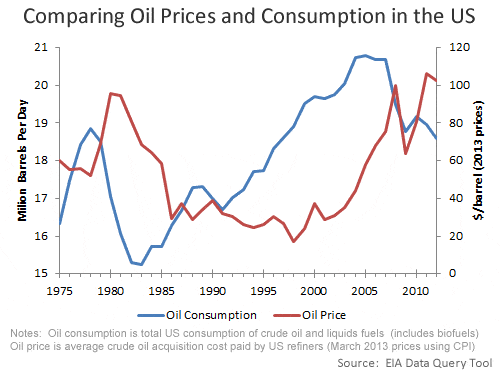
The 11% decline in US oil consumption from 2005-2012 does not match the 19% drop from 1978-83, but it dwarfs anything else in the last 40 years. This graph actually looks like it’s straight out of Econ 101. Stick the price up, we’ll consume less.
So there you go. Three potential ideas for why American’s are finally finding their love of fuel economy.
What do you think? Anything else going here?
Lindsay Wilson
I founded Shrink That Footprint in November 2012, after a long period of research. For many years I have calculated, studied and worked with carbon footprints, and Shrink That Footprint is that interest come to life.
I have an Economics degree from UCL, have previously worked as an energy efficiency analyst at BNEF and continue to work as a strategy consultant at Maneas. I have consulted to numerous clients in energy and finance, as well as the World Economic Forum.
When I’m not crunching carbon footprints you’ll often find me helping my two year old son tend to the tomatoes, salad and peppers growing in our upcycled greenhouse.
